Videos
Event Creation
Event Assignment
Event Report
Create an Account
To create an account on KiPosition, follow these steps:
- Access the KiPosition homepage and click on the 'Sign Up' button.
-
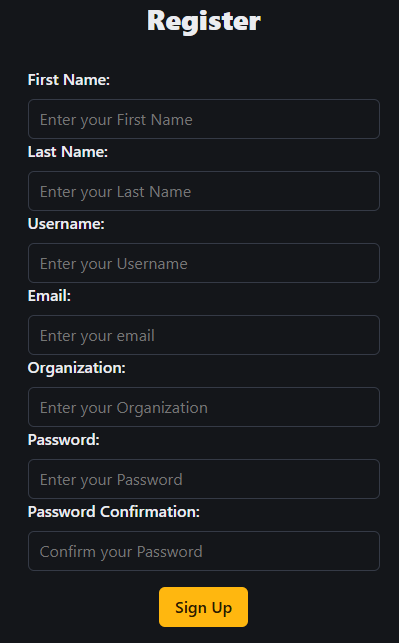
Fill out the registration form with the required information, typically:
- First name
- Last name
- Username
- Email address
- Organization
- Password
- Password confirmation
- Accept the Terms of Use: Read and accept the Terms of Use and Privacy Policy.
- Click the 'Sign Up' button to complete the registration.
- Check for a confirmation email: Look for a confirmation email in your inbox. Click the confirmation link in the email to activate your account.
Once these steps are completed, your account will be created, and you can log in to KiPosition.
Log In
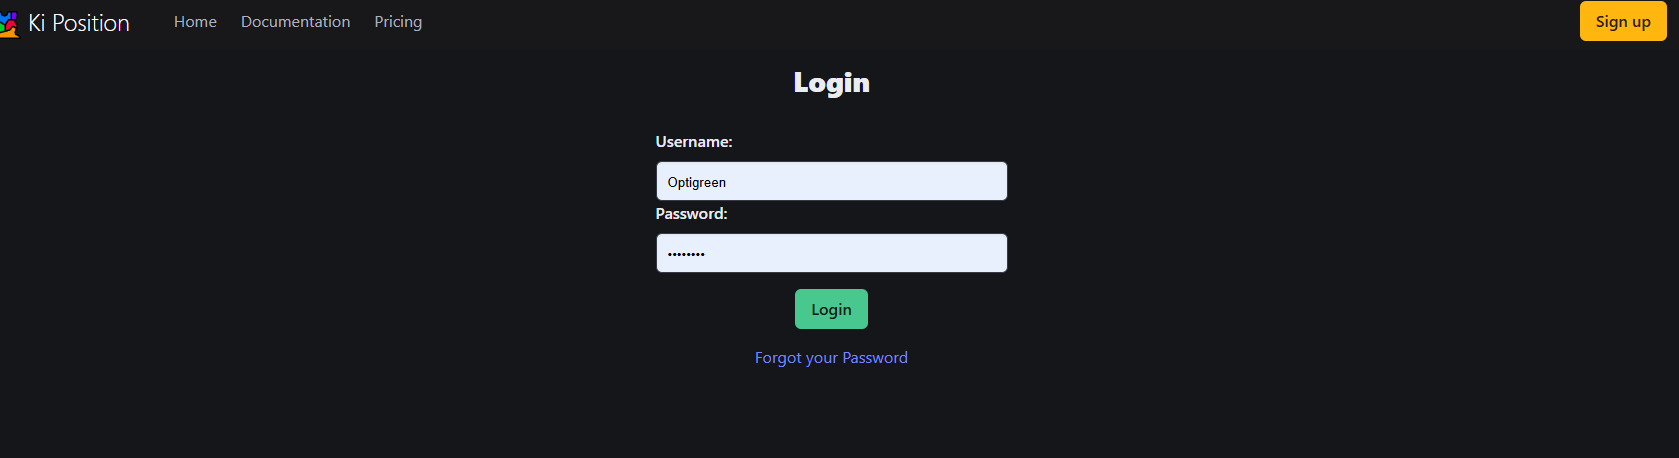
To log in to KiPosition, follow these simple steps:
- Go to the KiPosition homepage.
- Click the 'Sign Up' button.
- Enter your username and password.
- Finish by clicking the 'Login' button.
Password Recovery
For a secure login, always ensure that you are on the official KiPosition website before entering your credentials.
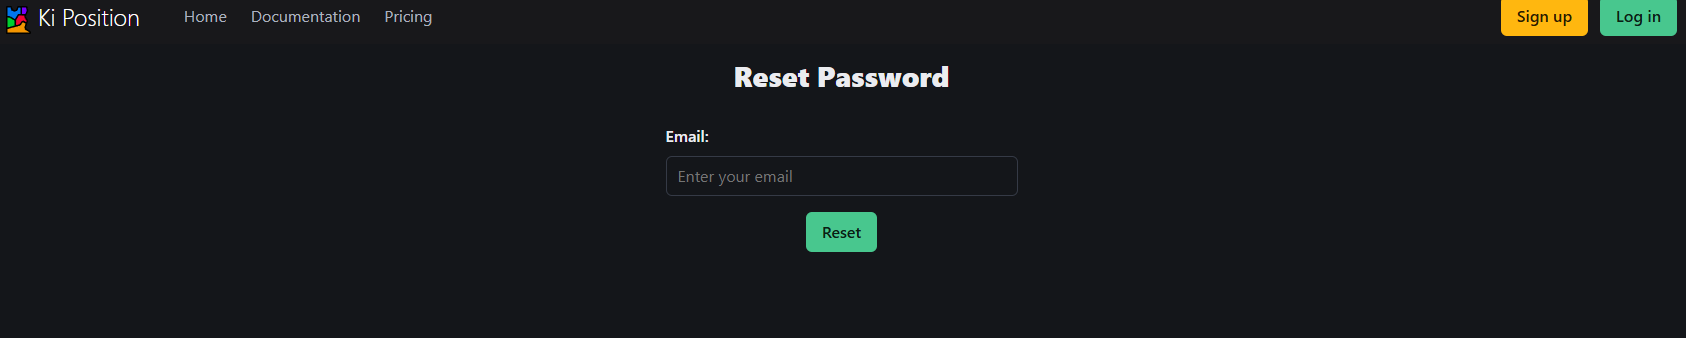
If you have forgotten your password, use the 'Forgot your password' option to reset it.
Modifying a User
To modify your user account, follow these simple steps:
1. Click on your username in the top-right corner of the page.
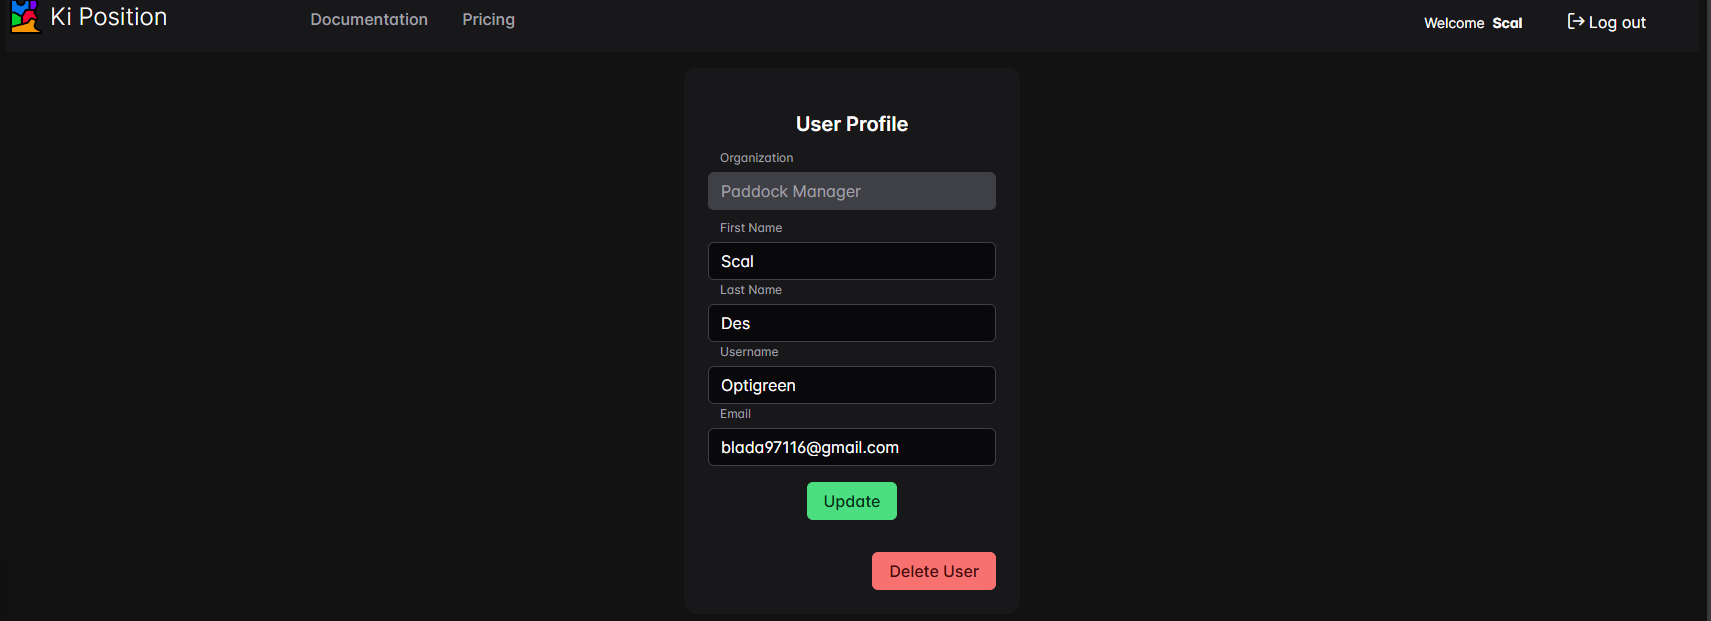
3. Finalize by clicking on “Update”. Your information will be updated.
Delete a User
To delete your user account, follow these simple steps:
1. Go to the KiPosition homepage.
2. Click on your username in the top-right corner of the page.
3. Select 'Delete user'.
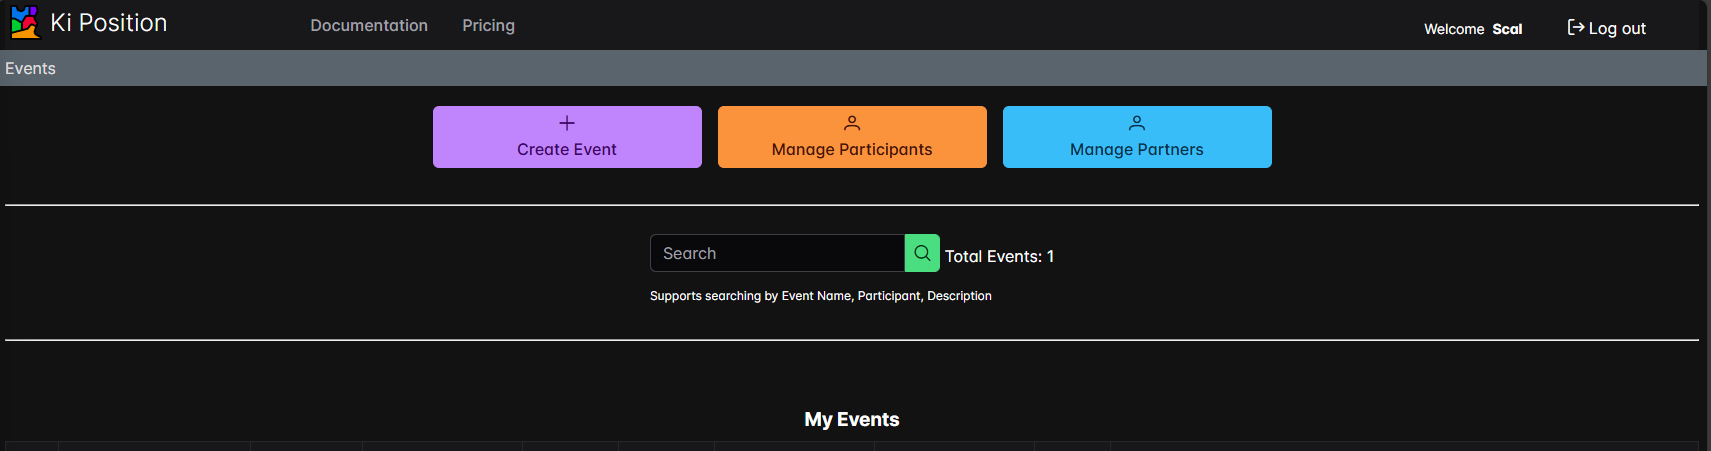
A confirmation message will be displayed to confirm that your deletion request has been processed successfully.
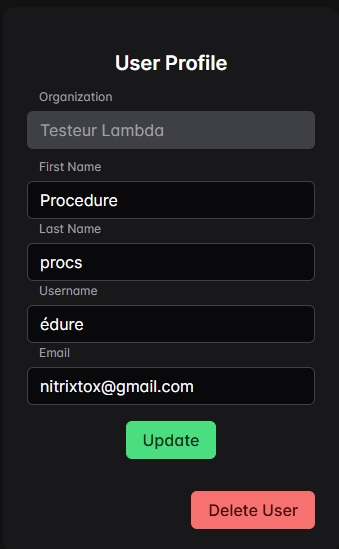
Your account will be deleted after confirmation.
Add Member
1. Click on your username in the top-right corner of the page.
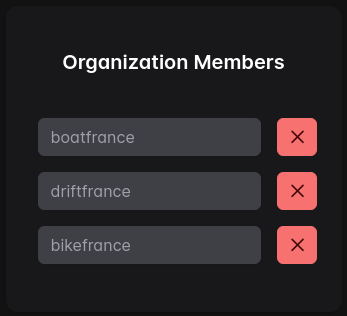
2. Scroll down to Organization Members Panel, then set username(s) you want to collaborate with.
3. Press on Invite Members button.
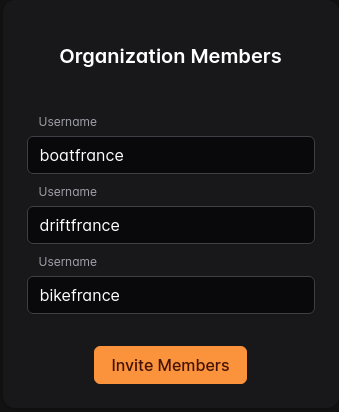
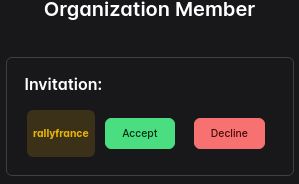
Users that receive the invitation must accept or decline the invitation.
Delete Member
You can delete a Member by pressing the cross button next to the Username.
Account Subscription
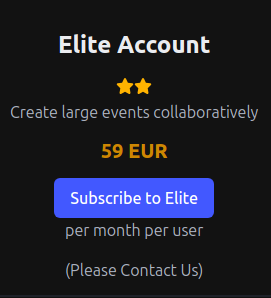
1. Click on the Pricing page.
2. Then click on the desired Account (Premium or Elite) for your subscription.
Ki Position offers a monthly subscription, and you can unsubscribe at any time.
Cancel Subscription
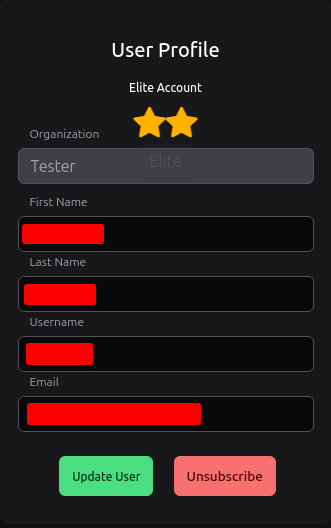
1. Click on your Profile.
2. Then click on Unsubscribe to cancel your monthly subscription.
Once canceled, you will not be charged for the upcoming months.
You can still login and view your events but with some limitations.
Event Creation
Creating an Event in 3 Steps:
- Choosing the Location
- Defining your event space
- Assigning places
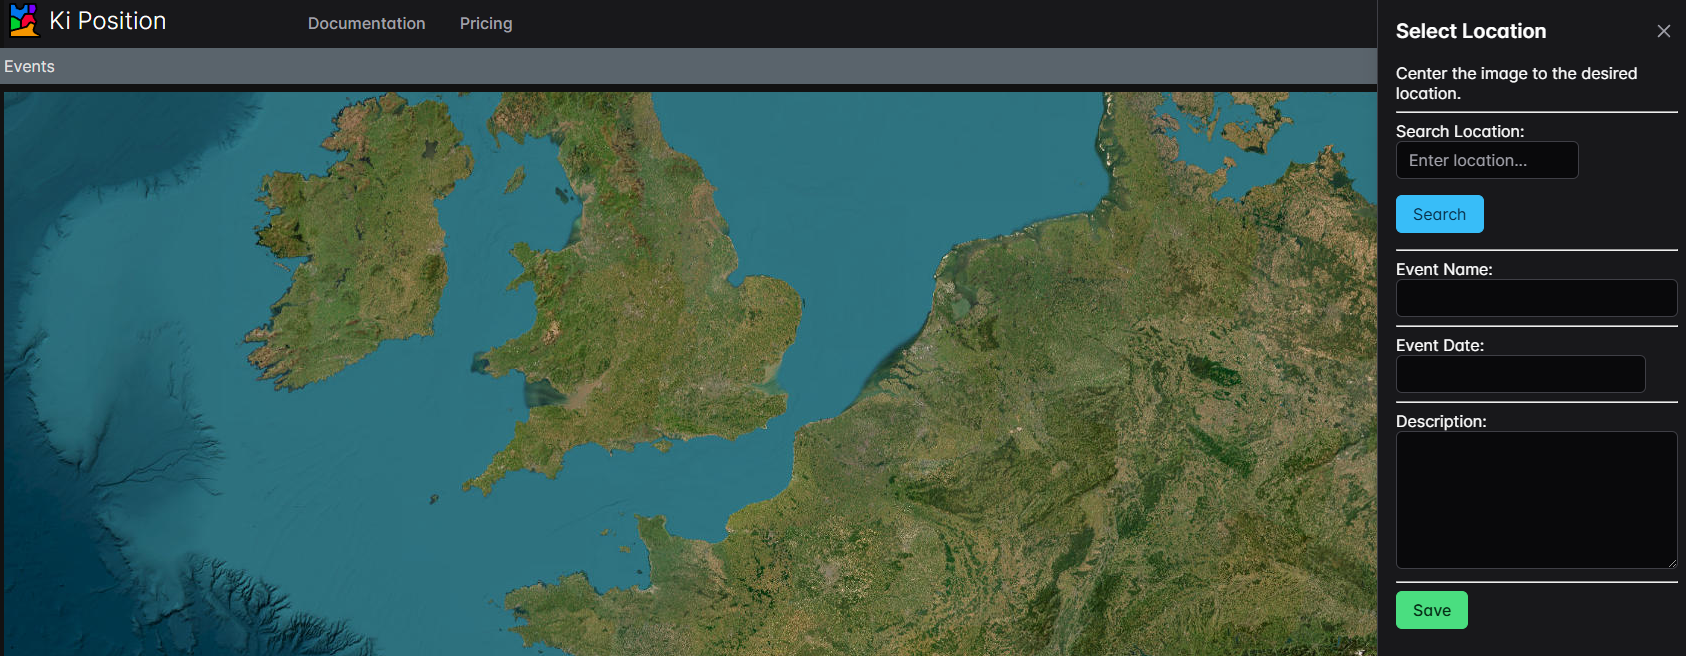
{% trans "To get started, from the main page of KiPosition, click on the “Create Event” button. You will then access a map and the menu to select your location, “Select Location”:" %}
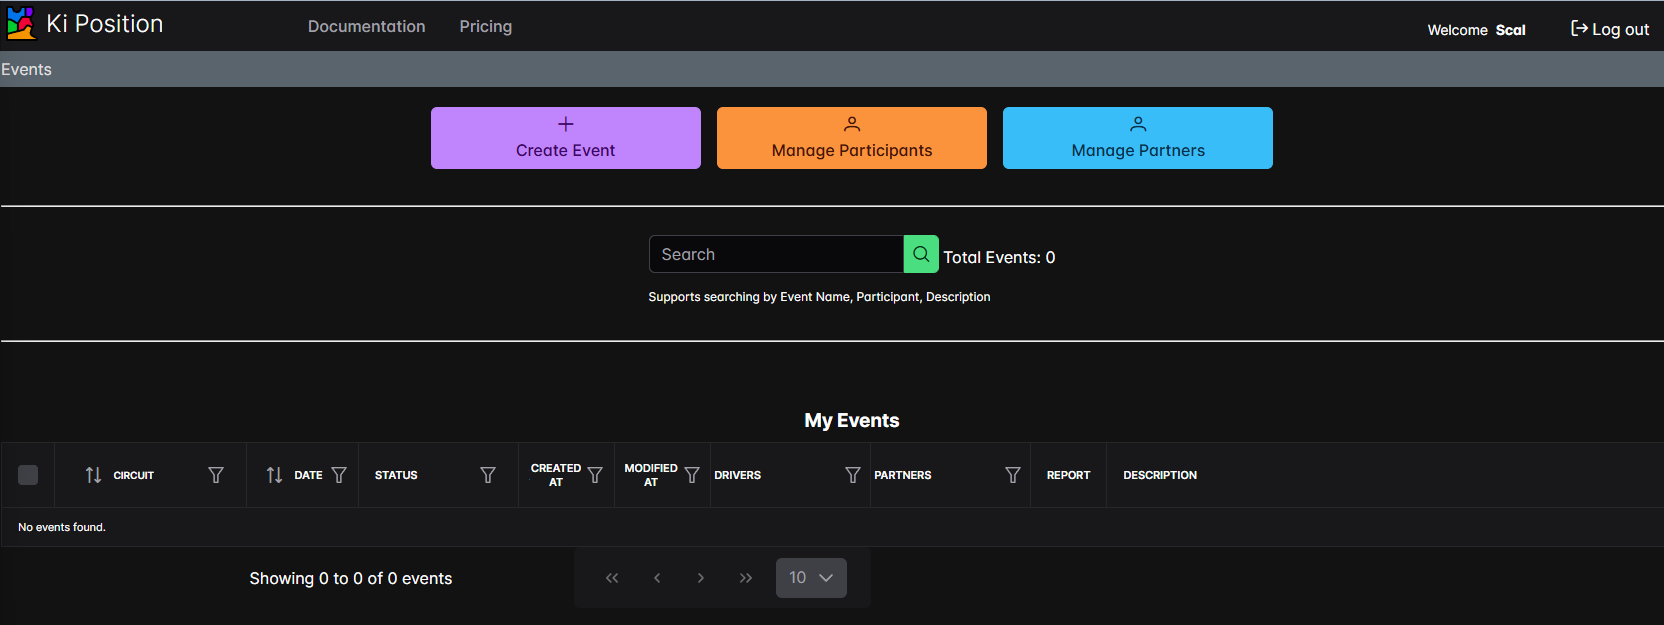
{% trans "1. Enter your location in the “Search Location” field, then click on “Search.” You can enter a city, venue, country, or address. The more precise the information you provide, the more effective the search will be." %}
2. Give a name to your event in the “Event Name” field.
3. Set the date of your event by selecting it.
4. Add a description to your event.
5. Finalize by clicking on “Save.
Modify an Event
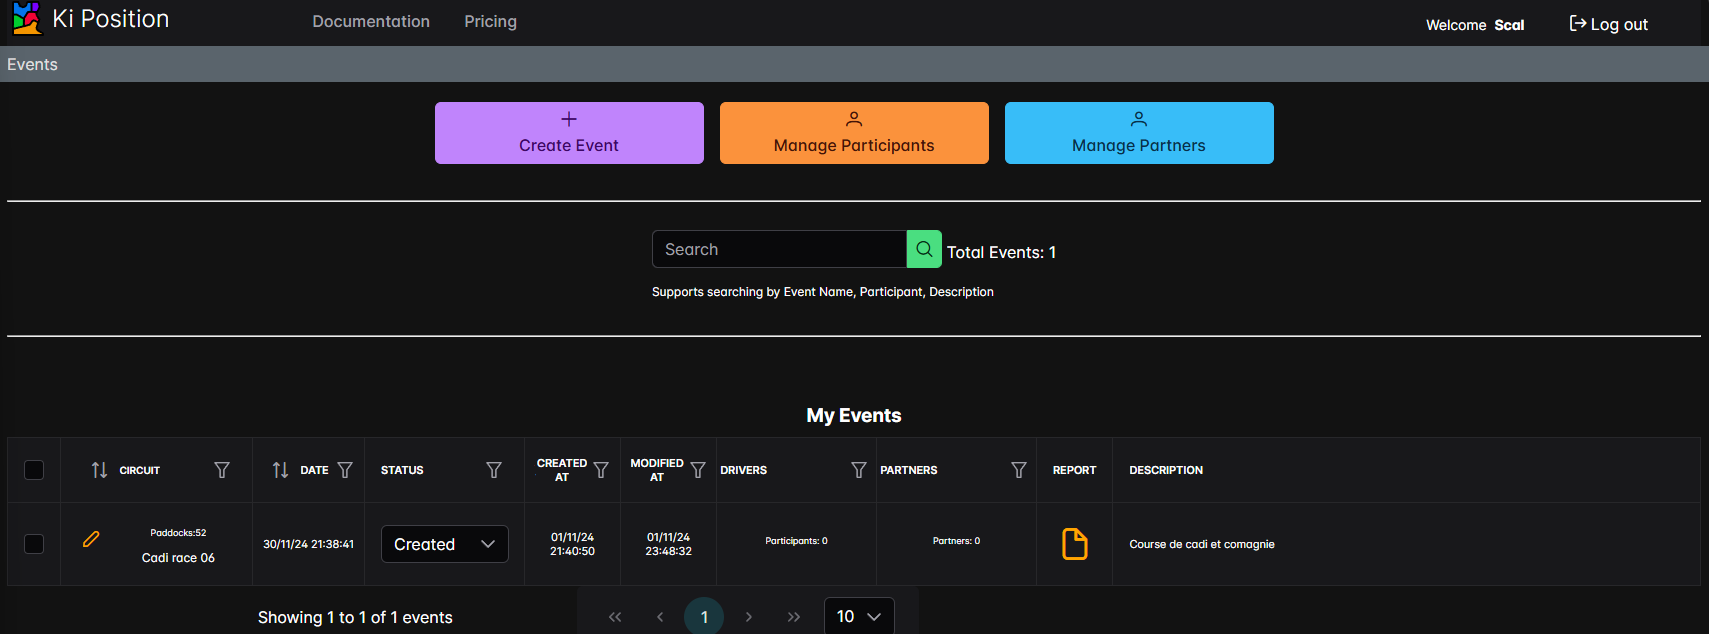
You will access your event area and have the option to modify its content from the 'Toolbox.'
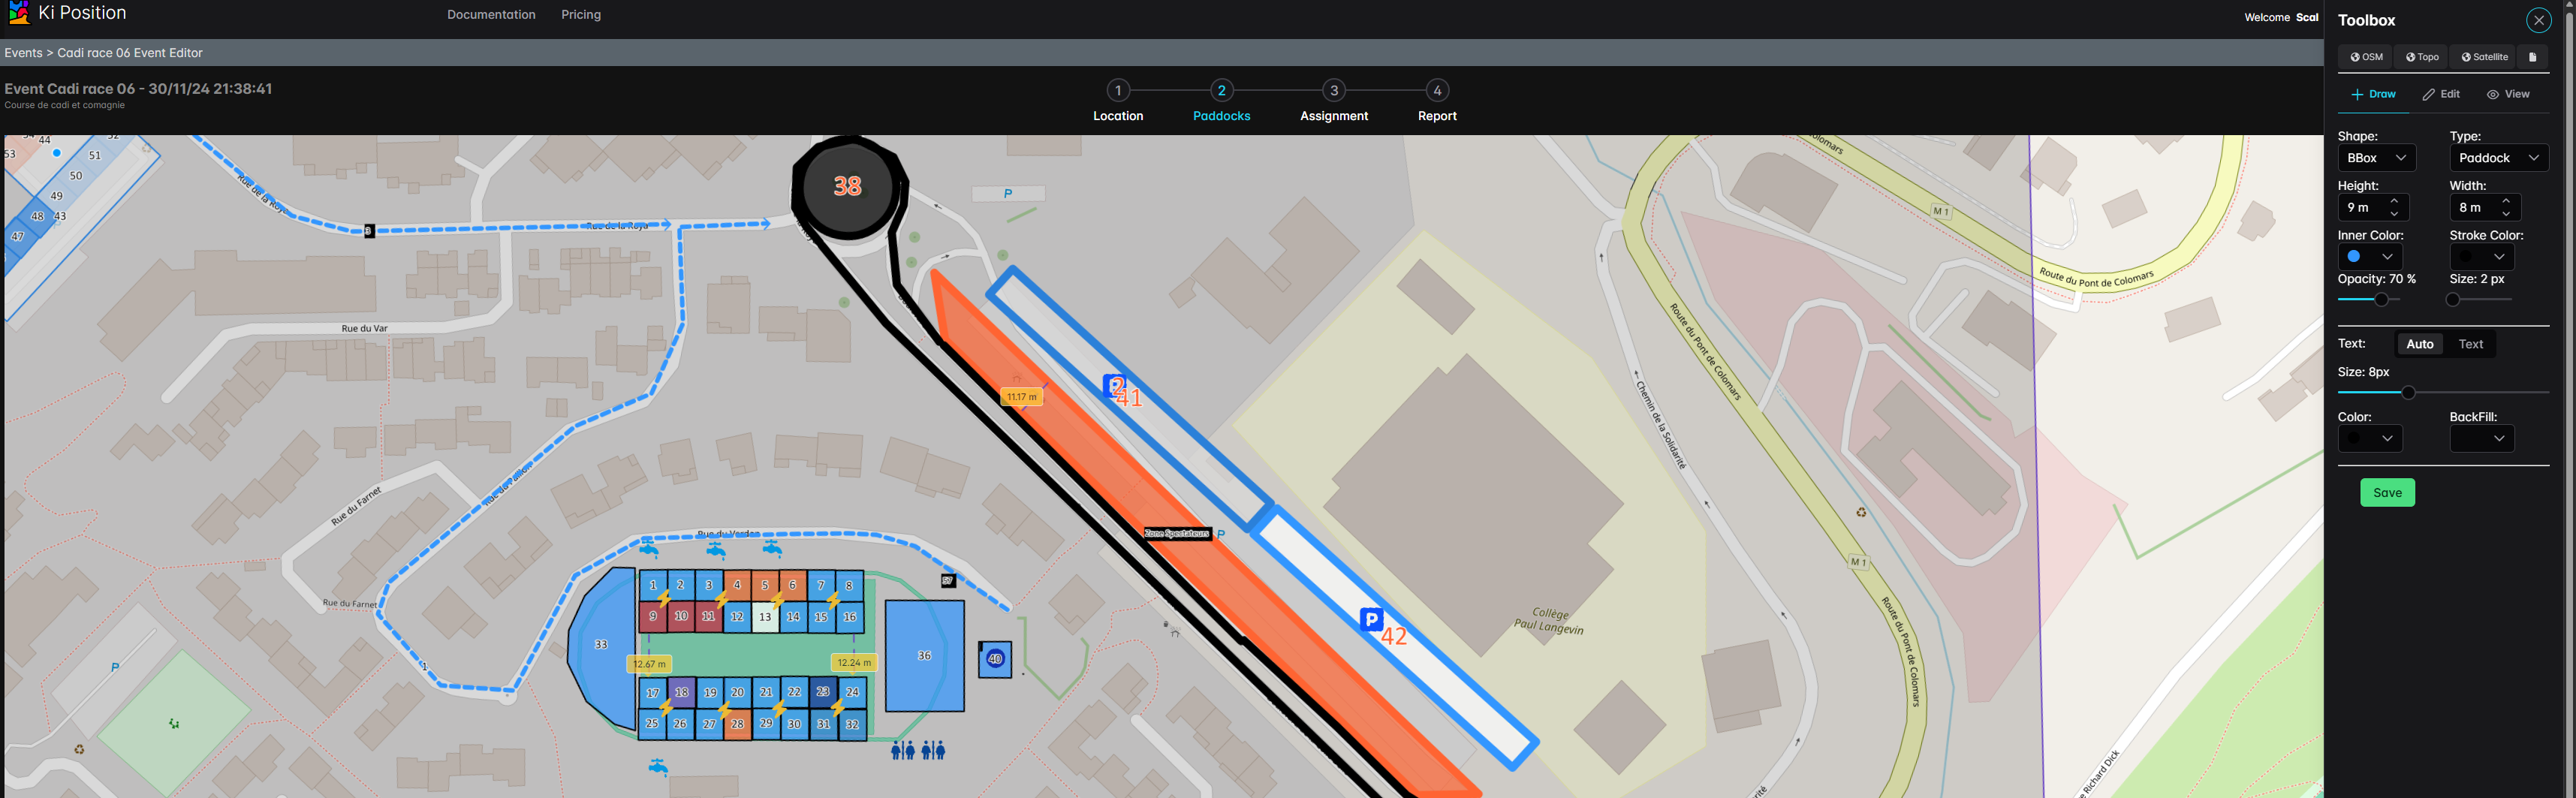
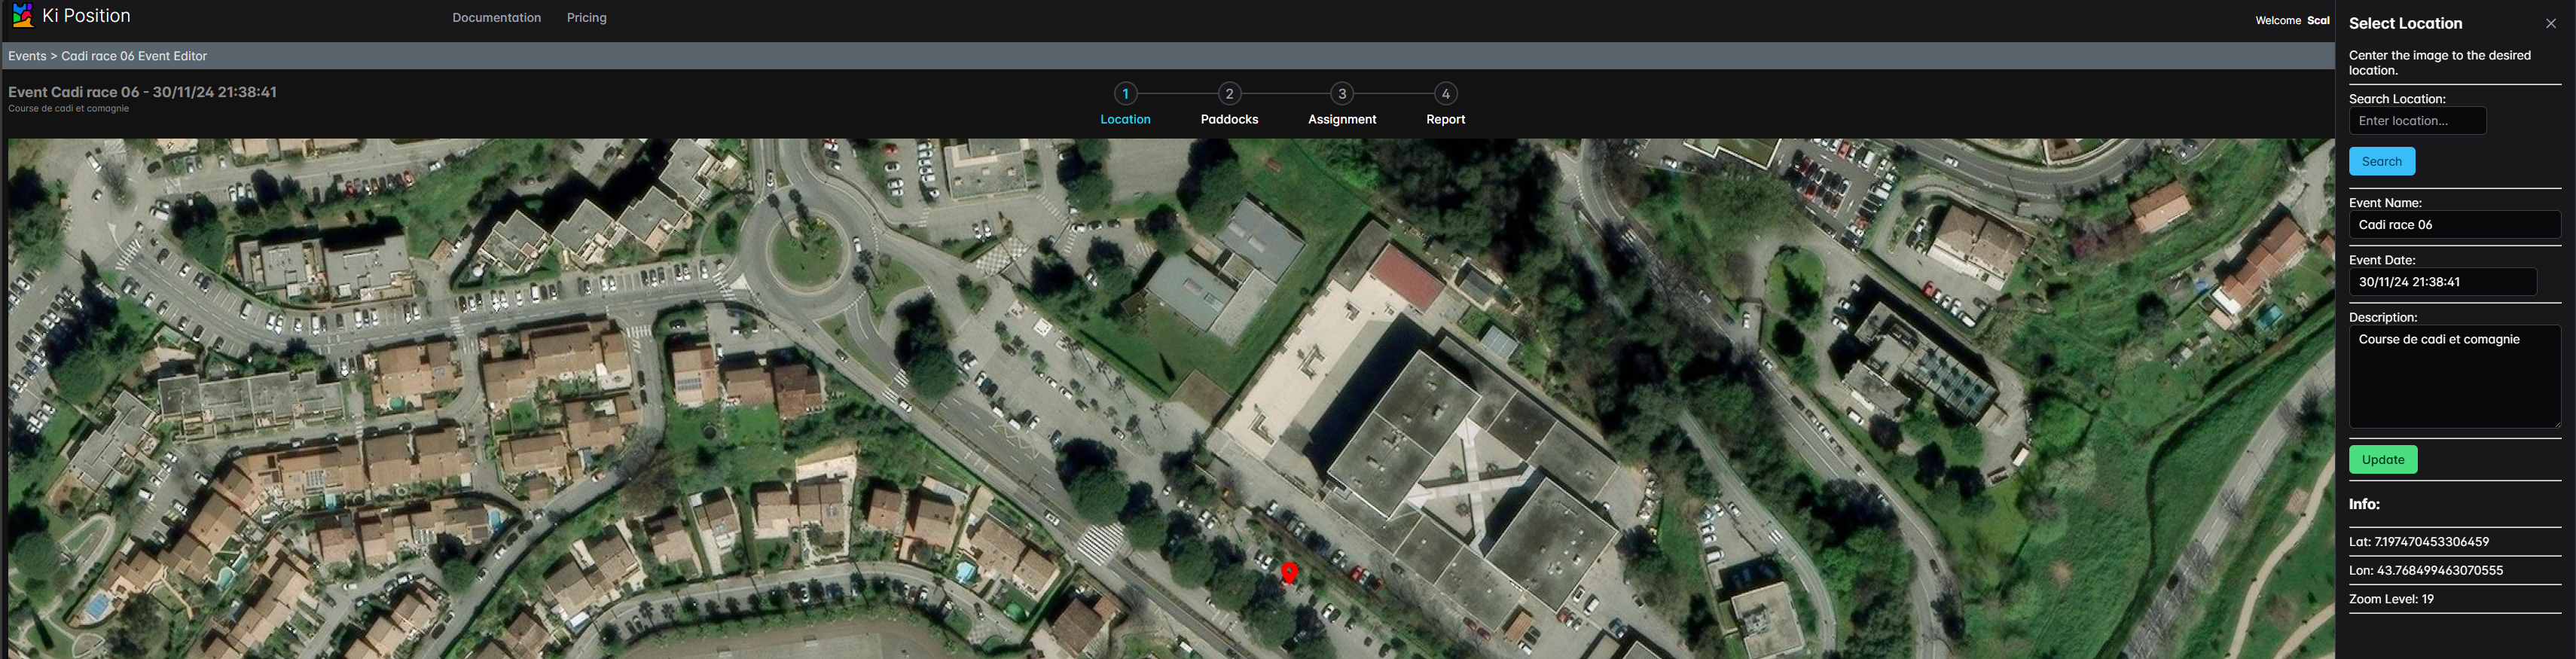
On the breadcrumb navigation located above the map, click on 'Location.' The “Select Location” menu will appear, allowing you to modify the location, name, date, and description of the event.
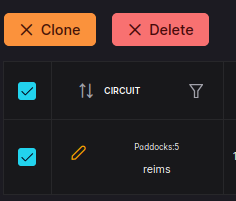
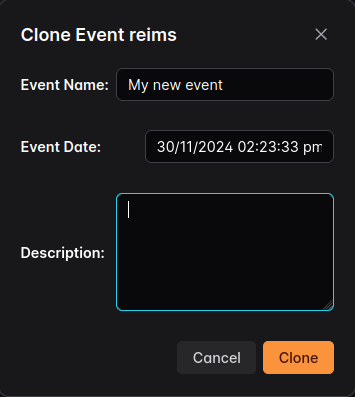
Cloning an Event
Delete an Event
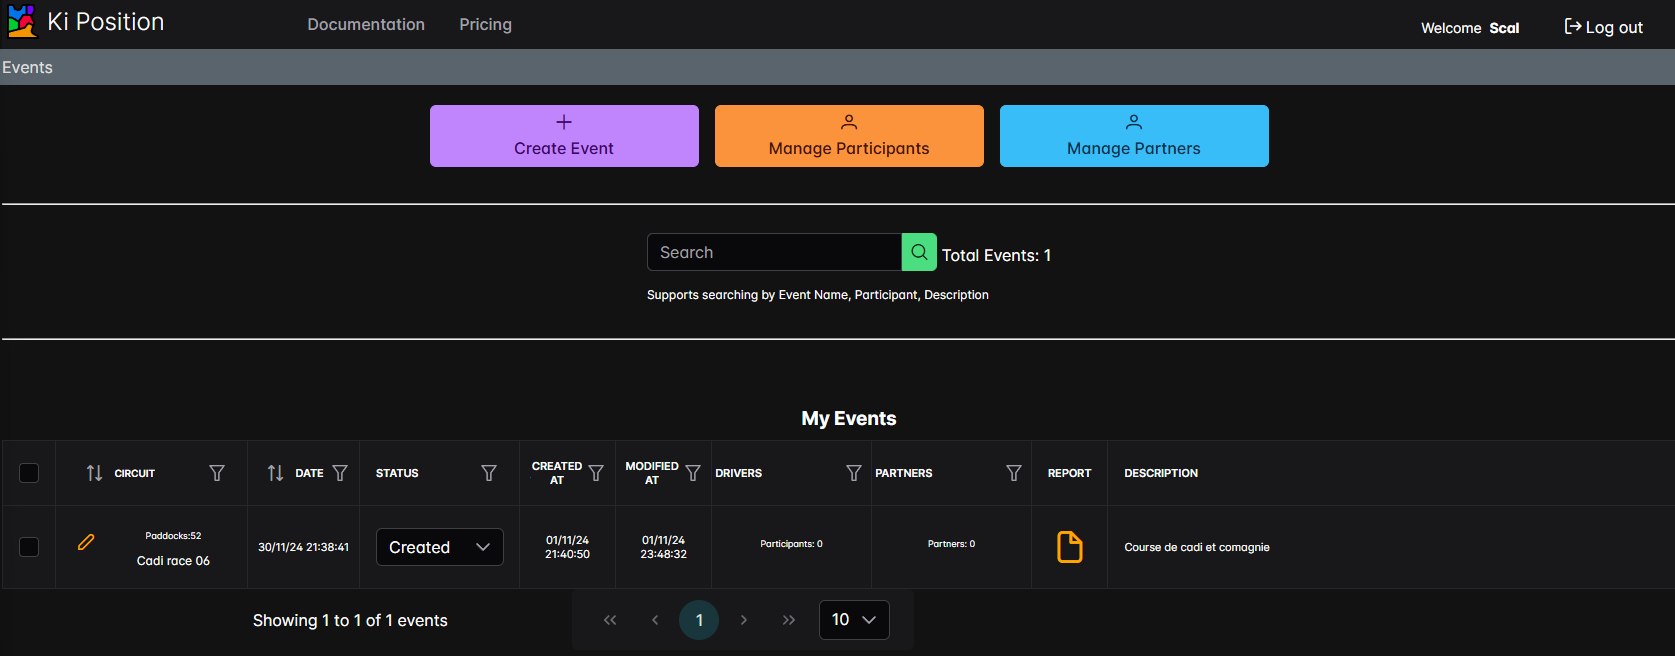
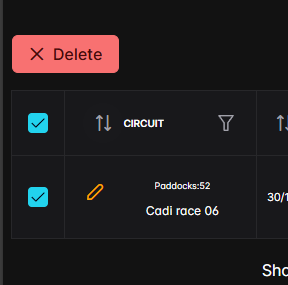
Select the event you want to delete using the checkbox on the left.
You will have the option to delete the event by clicking on the “Delete” button.
Map Orientation & Navigation
Orientation
By default, when creating an event, the displayed map has its vertical axis pointing north.
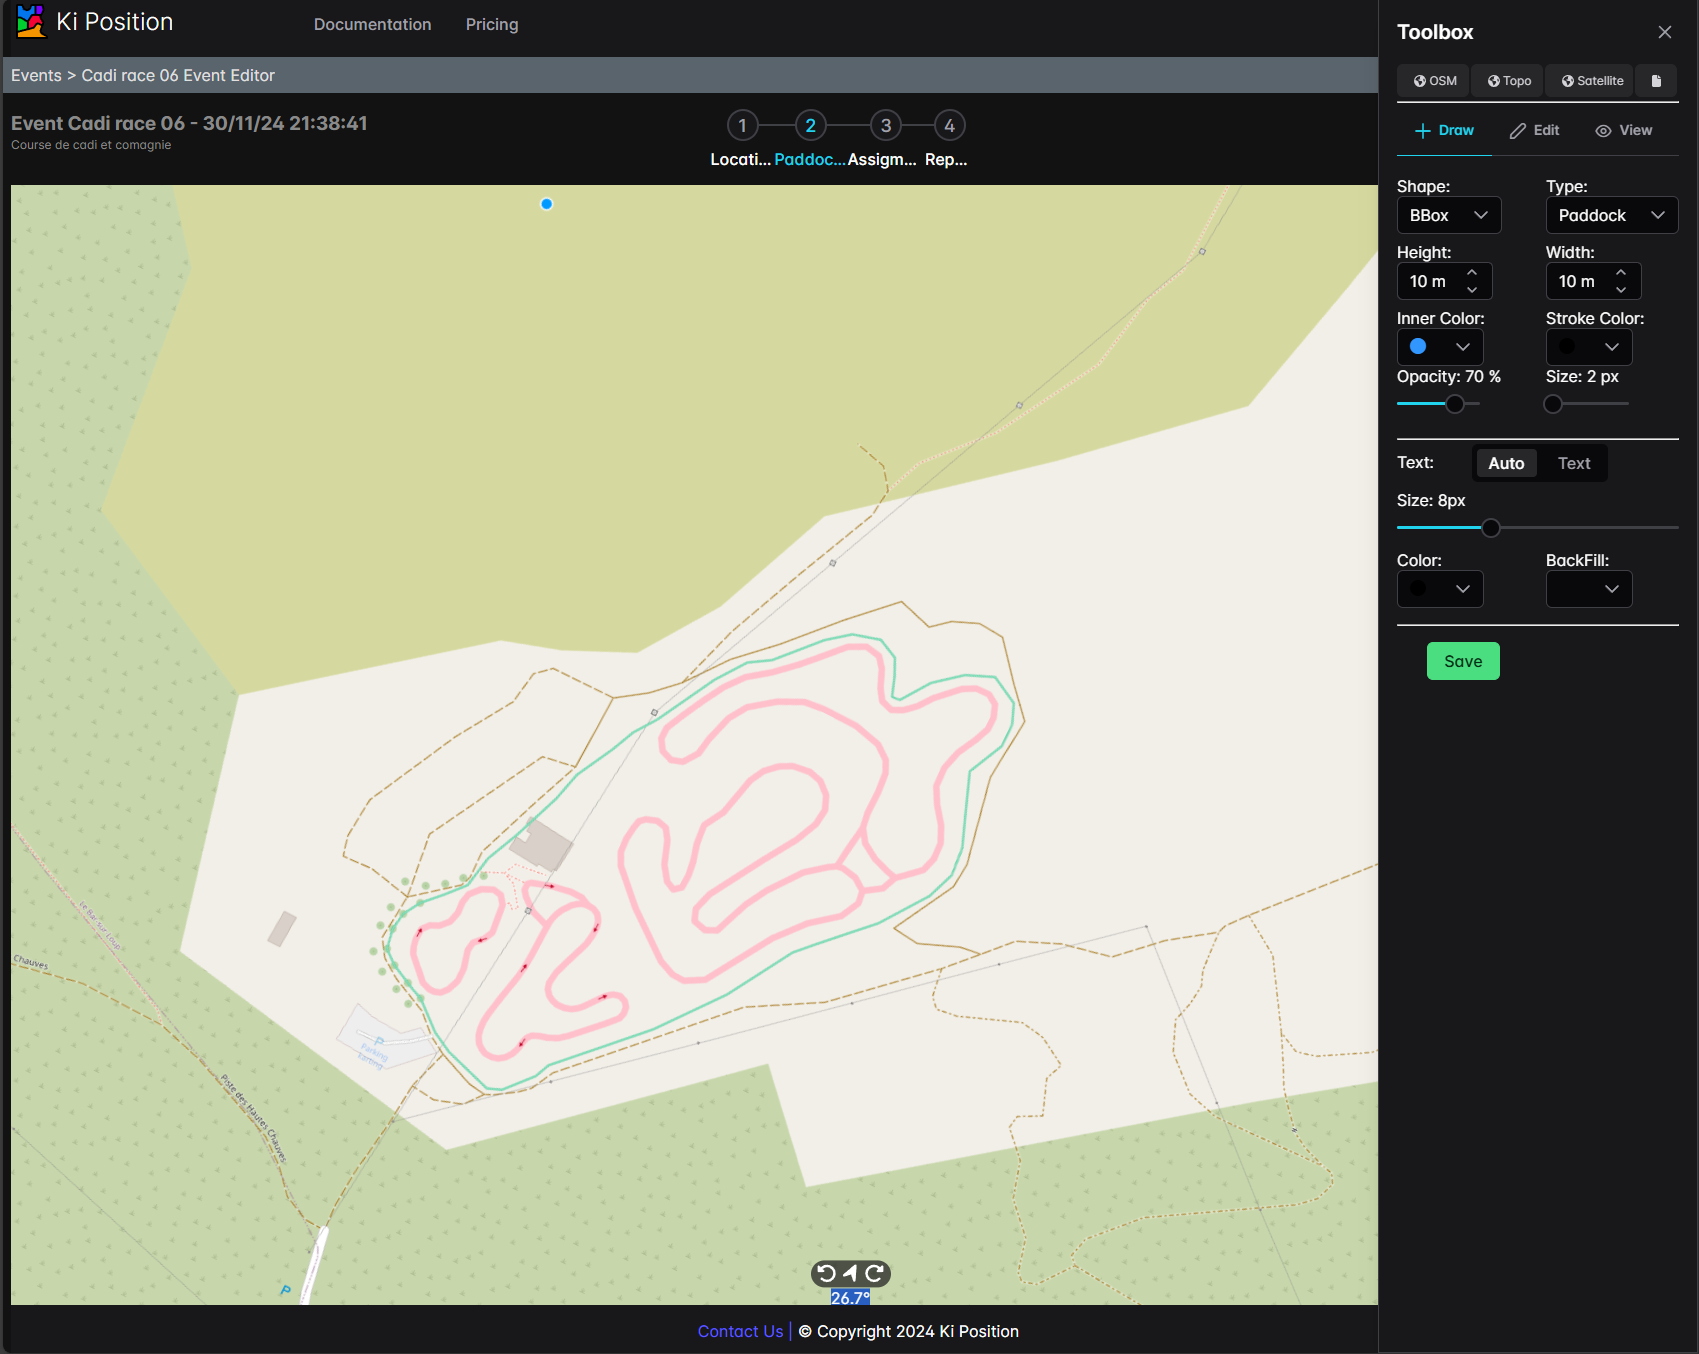
When viewing an event map, two rotation arrows at the bottom of the page allow you to rotate the map to the left or right. You can perform a full 360° rotation to find the angle that best suits your needs for working on your plan.
Once you've defined the working orientation of the map, it will be necessary to save it using the "Save" button available in the "Tool" menu.
Navigation
You can navigate the map by holding down the left mouse button and dragging it.
Map Object Types
Geometric Shapes
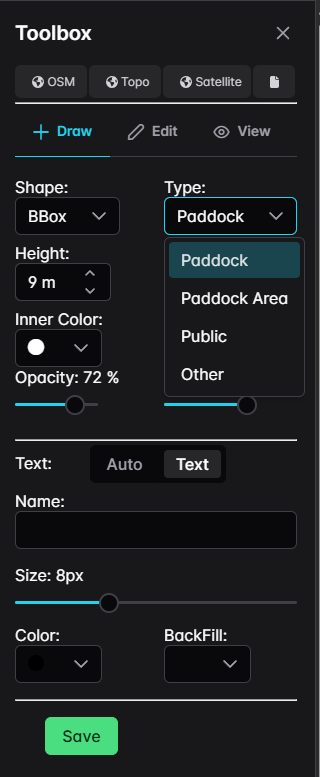
We can insert geometric shapes or lines into your event plan. These shapes come in various types, allowing them to be used with other KiPosition functionalities:
-
Paddock
- Impacted Shapes: Polygon, Circle, Box, Bbox
- Specificity: Allows Assignment of participants and partners.
-
Paddock Area
- Impacted Shapes: Polygon, Circle, Box, Bbox
-
Public
- Impacted Shapes: Polygon, Circle, Box, Bbox
Lines
-
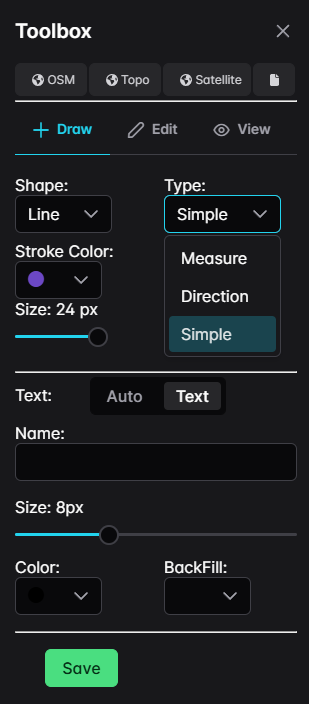
Measure
- Draw measurement lines. Double-click to finish drawing.
-
Direction
- Draw direction lines. Double-click to finish drawing.
-
Simple
- Draw simple lines. Double-click to finish drawing.
-
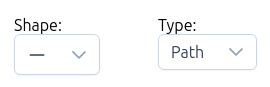
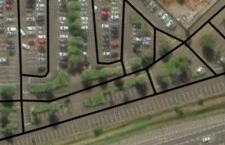
Path
- Used by the Tracking System to determine the shortest path.
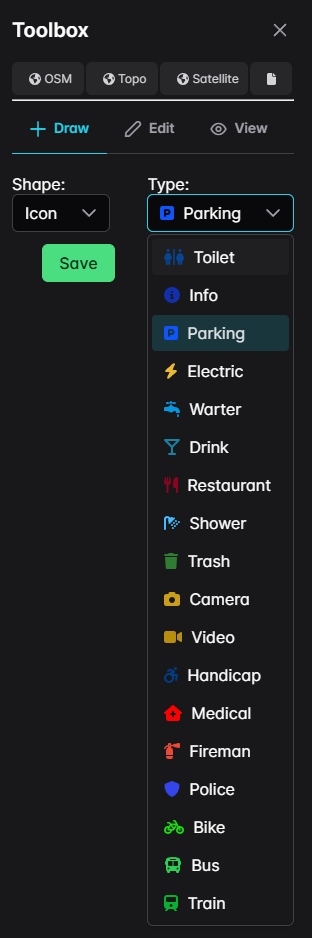
Icons
-
Various icons can be added to enhance your map with visual indicators.
Image
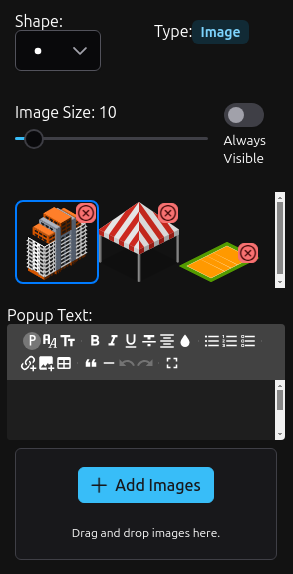
You can add images on the map.
-
- Add one or multiple images by clicking on Add Images Button, or use the Drag and drop area.
- Select the Image by clicking on it. Click again to go back to Icon Image
- Then click on the map to paste the image.
- Enable Always visible to keep the icon at a constant pixel size on the screen, regardless of zoom level.
Text Management
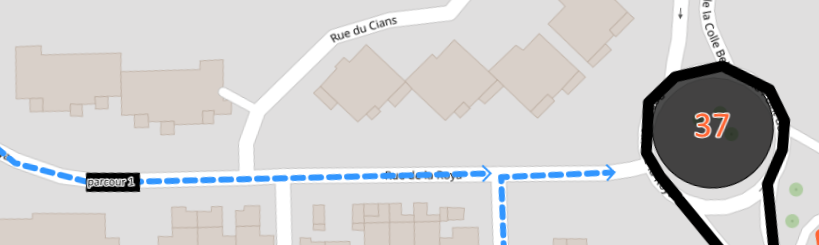
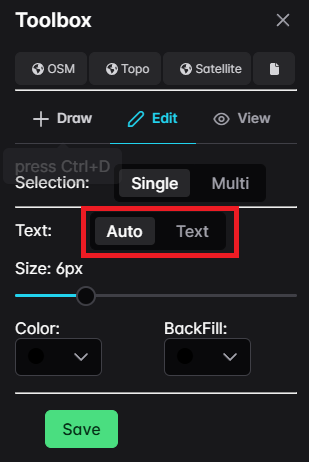
You can add text to each shape. There are two types of text:
-
Auto
- Automatically assigns a number to a shape.
- Available only for closed shapes.
- The numbering is sequential and automatic.
- Upon deletion of a shape, the numbering is recalculated for the remaining shapes on the plan.
-
Text
- Allows writing free text.
- Available for all objects except icons.
Color and Texture Management
Shapes can be customized with textures and/or colors. Depending on the objects, various configurations are available in the Toolbox:
-
For Geometric Shapes:
- Inner Color: Defines the color inside the shape.
- Stroke Color: Defines the color of the borders.
- Opacity: Manages the transparency of the shape's interior.
- Size: Defines the width of the border.
-
For Text:
- Size: Manages the text size.
- Color: Defines the text color.
- BackFill: Defines the color around the text. Set to “None” to have no background color.
Draw Toolbox
Draw a New Object
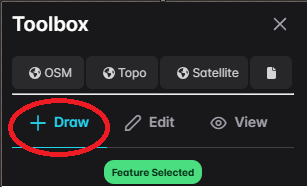
The placement of an object is done using the Toolbox in the 'Draw' tab. Select your object, define its properties, and then use your mouse to position the object on the map at the desired location. The 'Draw' mode is indicated by a blue pointer at the tip of your mouse, making it easy to know which mode you're in.
Drawing a Line or Polygon
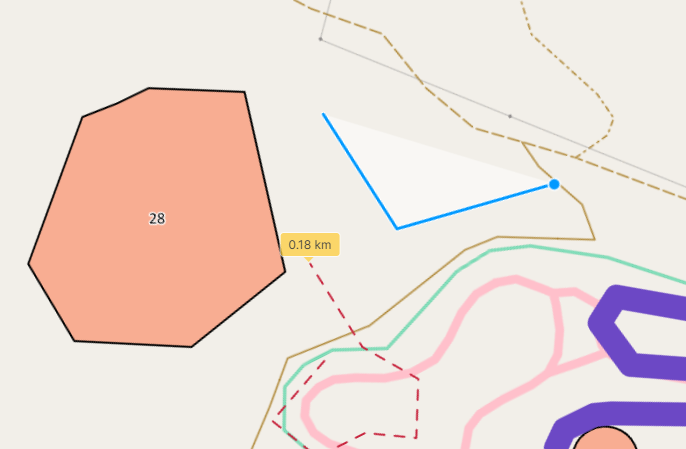
When drawing a line (measurement, direction, or simple), a single click represents a step of the drawing process. To finish the drawing, a double click is required. Similarly, for polygons, a single click represents a step, and the drawing ends with a double click.
Drawing a Circle
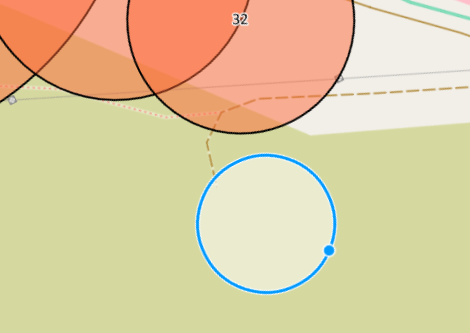
When drawing a circle (also available in the Toolbox selection), the mouse pointer will be positioned on the circumference of the circle, not at the center. The further you move the mouse from the initial point, the larger the radius of the circle becomes.
To finish drawing the circle, a simple click is required.
Modification of an Object
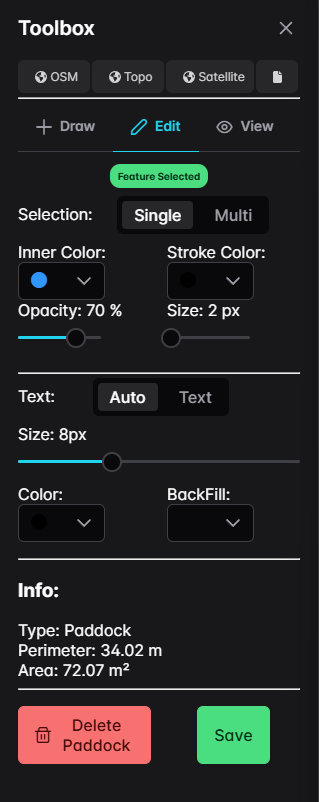
Modifying an object is possible from the 'Edit' tab. The following modifications are available:
- Change colors
- Modify the border
- Adjust opacity
- Edit the text
Move an Object
The movement of an object can be done from the Toolbox in the Edit tab by choosing the Selection option as 'Single'.
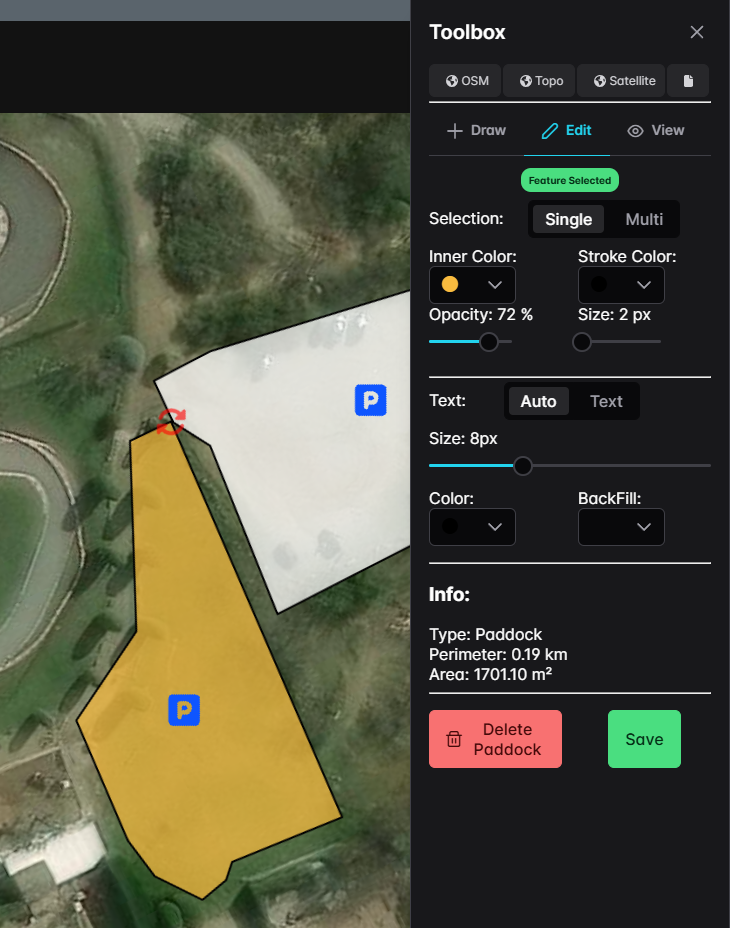
You will then need to select the desired object by clicking on it. The appearance of a red arrow wheel will indicate that the item has been selected.
Multiple Selection and Movement
Translating, Rotating, Copying and Deleting multiple objects are possible from the Toolbox in the Edit tab. You will need to set the Selection to types Multi.
You can then select multiple objects by drawing a rectangular selection area with the mouse. All objects included in the defined area can be moved to the desired location by selecting and dragging the entire area.
Rotation & Translation
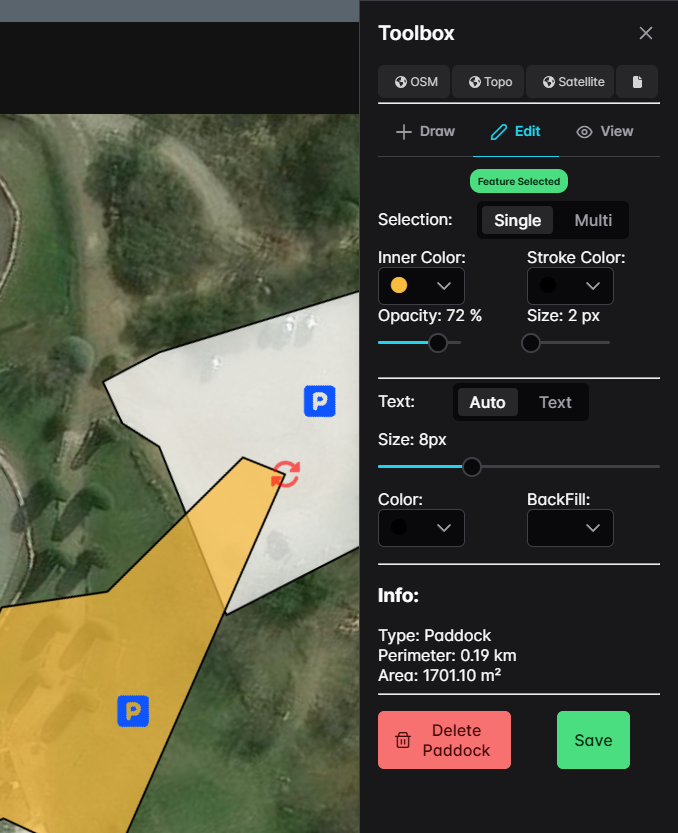
To rotate your object, select the object and click by holding the arrow wheel. You can then rotate the object. The center of rotation will be located in the middle of the selected object.
To translate your object, select the object and click by holding on the shape. You can then translate the object.
Moving with Keyboard Arrows
When a shape is selected, you can move the object using the keyboard with Left, Right, Up, and Down arrow keys.
Moving with the Mouse
When a shape is selected, holding down the click on the object will display a hand cursor. You can then drag the object to the desired location by moving the mouse.
Re-Order Shapes
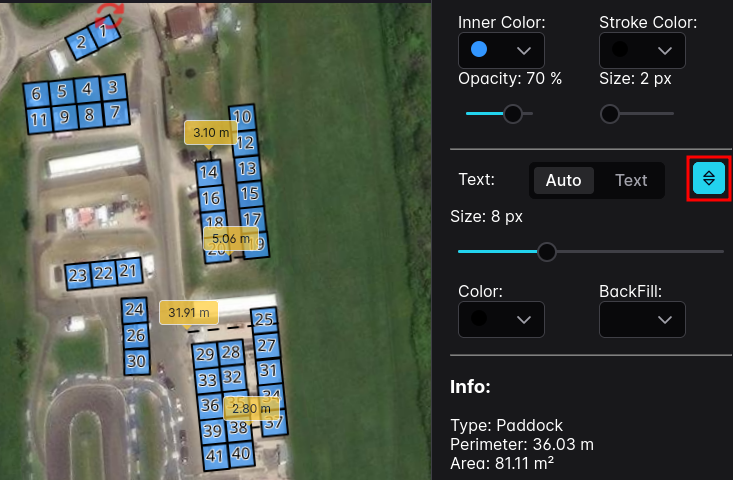
When a shape is selected, you can re-order all associated shapes in one click using the Re-Order button. The re-ordering process aligns the shapes according to the map's orientation.
Layers management
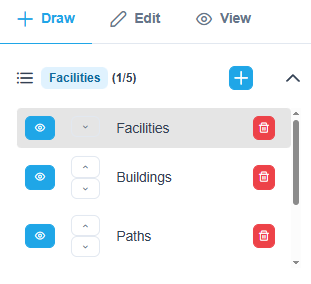
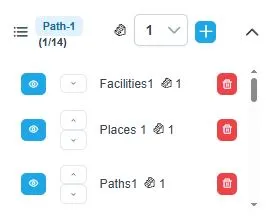
Layers allow you to organize and control the visibility of elements displayed on the map. Each layer can represent a specific category such as facilities, buildings, or paths.
-
Layer groups
Objects are grouped into layers. This allows you to control which objects appear above others and to assign them to specific floor levels. -
Show or hide a layer
Click the eye icon to toggle the visibility of a layer on the map. Hidden layers remain available but are not displayed. -
Reorder layers
Click the up or down arrows to change the drawing order of layers on the map. -
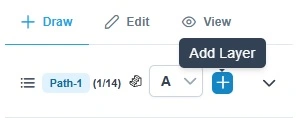
Add a new layer
Click the plus (+) button to create a new layer. -
Delete a layer
Click the trash icon to permanently remove a layer. This action cannot be undone. -
Layer modes
Use the top menu to switch between Draw, Edit, and View modes. Each mode changes how you interact with the map layers.
Proper use of layers helps keep the map clear, organized, and easy to read, especially for complex events.
Floor Management
Layer Floor Assignment
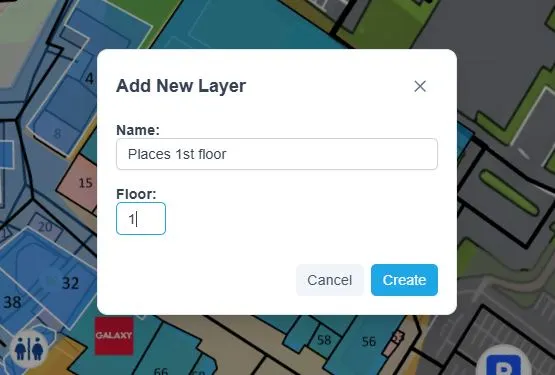
Each layer can be assigned to a specific floor level (0, 1, 2, etc.). When creating a new layer in the Layer Manager, a floor number field allows you to define which floor the layer belongs to.
Floor 0 is typically used for ground-level or outdoor elements. Higher numbers represent upper floors of a building.
Floor-Aware Object Types
Certain point object types are specifically designed for multi-floor environments. These objects define how people can move between floors:
-
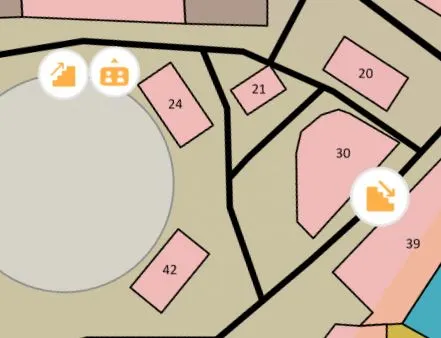
Stairs
A generic stair point that allows movement in any direction between connected floors. -
Stairs Up / Stairs Down
Directional stair points that only allow movement in one direction. 'Stairs Up' can only be used to go to a higher floor, while 'Stairs Down' can only be used to go to a lower floor. -
Elevator
A generic elevator point that allows movement in any direction between connected floors. -
Elevator Up / Elevator Down
Directional elevator points that only allow movement in one direction. These are useful when an elevator only travels upward or downward from a specific floor.
Place these point objects on the map using the Draw Toolbox to define cross-floor access points. Multiple access points at the same location on different floors are automatically linked as a single shaft (e.g., a staircase that passes through all floors).
Layer Manager Floor Filtering
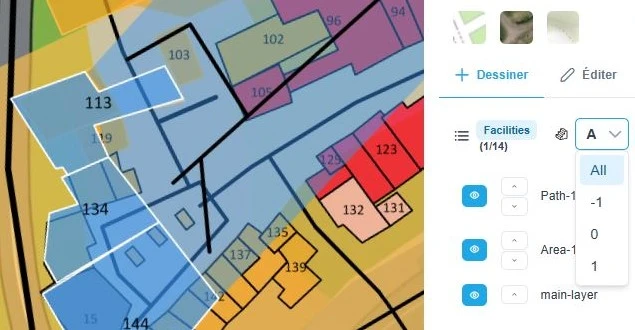
The Layer Manager includes a floor filter that lets you show all floors or focus on a specific floor.
-
All Floors
The default view shows layers from every floor simultaneously. -
Single Floor
Select a specific floor number to only display layers assigned to that floor. Layers without an assigned floor (defaulting to floor 0) are shown when floor 0 is selected.
The floor filter only appears in the Layer Manager when the event contains layers on two or more different floors.
Floor Data in Reports
Floor information is saved as part of the report data. When you save a report, each layer's floor assignment is stored in the report's GeoJSON data.
When the report is loaded, the floor properties are restored on both the layers and individual features. The floor selector in the Tracking view is also restored to the floor that was active when the report was last saved.
Floor Navigation
Floor Selector in Tracking
When an event contains layers on multiple floors, a floor selector dropdown appears in the Tracking view next to the report layer selector.
The floor selector shows a stairs icon and a dropdown list of available floor numbers. Select a floor to display only the layers and features assigned to that floor on the map.
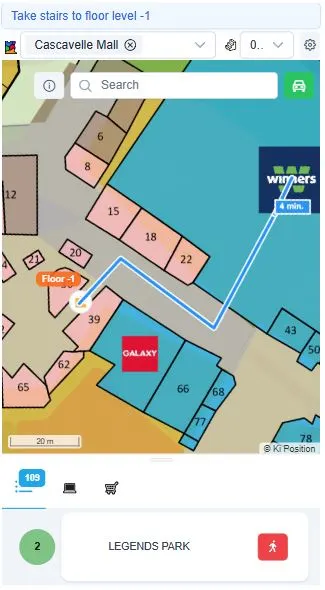
Switching Floors
When you switch to a different floor using the selector:
- Layers assigned to other floors are hidden from the map.
- Only layers and features on the selected floor remain visible.
- The routing system is automatically updated to use only paths available on the selected floor.
- If a route was already displayed, it is recalculated for the new floor.
Cross-Floor Routing
When a participant requests directions to a destination on a different floor, the system automatically calculates the shortest route through available stairs or elevators.
The route is split into multiple segments:
-
Current Floor Segment
The path from the participant's current position to the nearest stair or elevator on the current floor. -
Floor Transition
The participant moves between floors using the identified stair or elevator shaft. -
Destination Floor Segment
The path from the stair or elevator on the destination floor to the final destination.
The system selects the stair or elevator shaft that minimizes the total walking distance.
Navigation Hints
When the destination is on a different floor, the Tracking view provides visual guidance to help the participant reach the correct floor.
-
Info Banner
An information banner appears at the top of the map indicating whether to take stairs or an elevator, along with the destination floor number. For example: 'Take stairs to floor level 2' or 'Take elevator to floor 2'. -
Guide Line
A dashed orange line is drawn on the map from the participant's current position toward the nearest stair or elevator on the current floor. This helps participants find the correct access point to change floors. -
Floor Badge
An orange badge labeled with the destination floor number is displayed near the stair or elevator access point on the map.
These hints are automatically removed when the participant switches to the destination floor or clears the route.
Route Display on Multi-Floor Events
Only the route segment relevant to the currently viewed floor is displayed on the map. When you switch floors, the route display updates to show the segment for the new floor.
The route includes walking time estimates based on an average walking speed of 5 km/h. The estimated time is shown as a label along the route path.
Background Maps
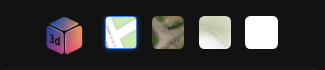
KiPosition provides the ability to display your maps in various views:
OSM (OpenStreetMap)
OpenStreetMap (OSM) is a world map created by a community of volunteer mappers. It provides a detailed view of streets, buildings, and points of interest. This option is ideal for precise urban navigation and visualizing local infrastructures.
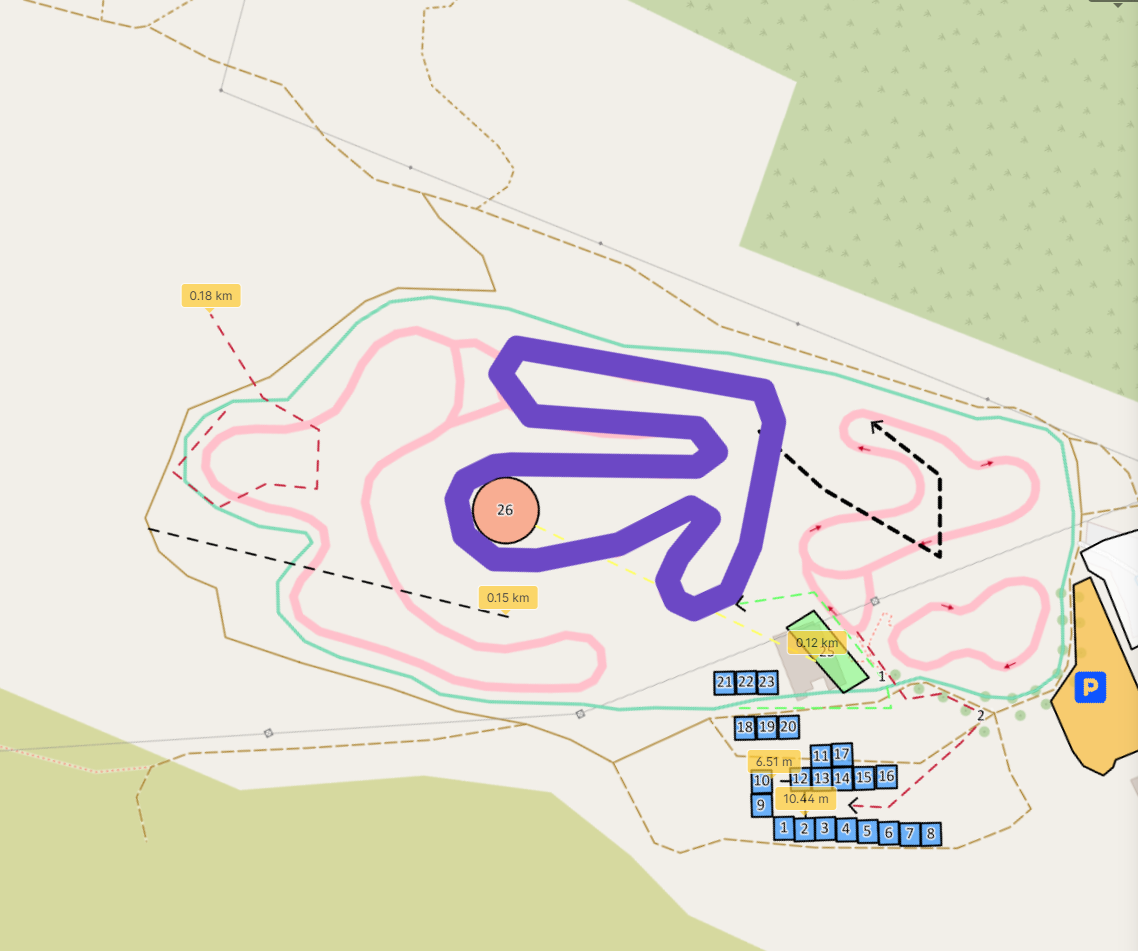
TOPO (Topographic View)
The Topographic View (TOPO) provides a detailed representation of terrain relief and physical features. It highlights contour lines, elevations, and landscape shapes. This option is especially useful for outdoor activities, hiking, or terrain analysis.
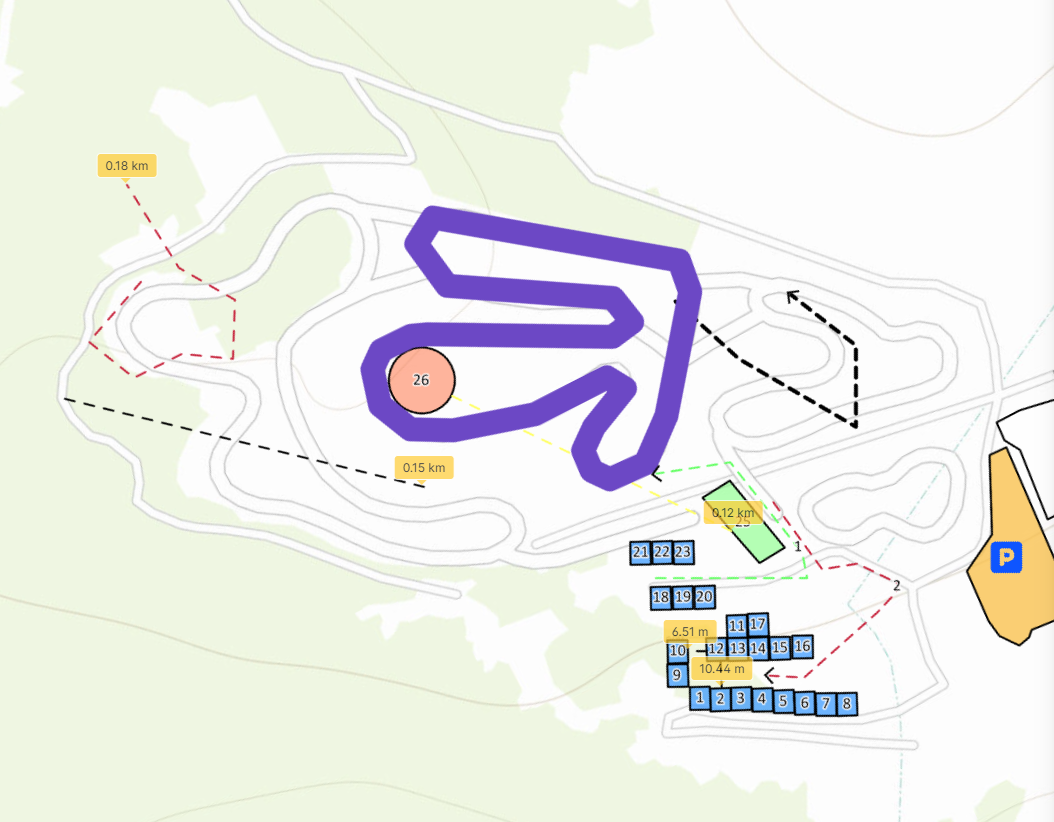
Satellite View
The Satellite View provides real aerial imagery of the Earth's surface. This option allows for precise visualization of terrain, buildings, and vegetation as seen from space. It is particularly useful for observing urban areas, analyzing landscapes, and planning routes in less-mapped regions.
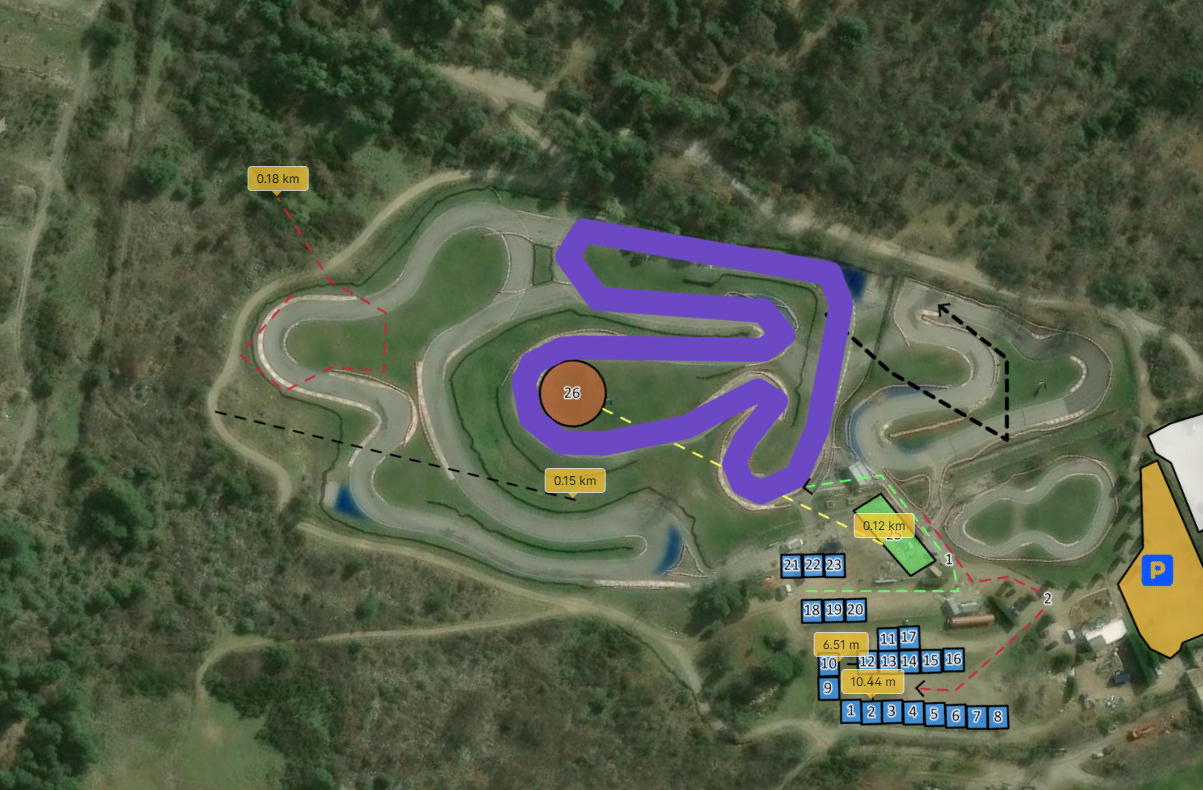
Your Map
The Your Map feature allows you to overlay a high-resolution image to serve as a detailed background during the zoom phase. You can add a highly detailed custom background and adjust the image directly on the map to fit the geographic location perfectly.
1. Add a New Map in 'Map Tab'
Click the + icon in the top right corner to initiate a new map layer.
2. Upload High-Resolution Image
Select and upload your high-resolution image file (maximum size: 100MB).
3. Align Image with Satellite View
Drag, scale, and rotate the uploaded image to match the underlying satellite imagery. Adjust the opacity slider to ensure exact alignment with roads, buildings, or landmarks.
4. Refresh the Page after 5 minutes
After saving your adjustments, please refresh the page after 5 minutes to allow the high-resolution tiles to render completely. Your detailed background will then be visible in the layer selection view.
1. Add a New Map
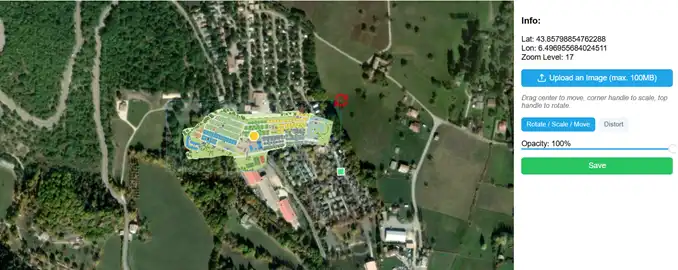
2. Upload High Resolution Image
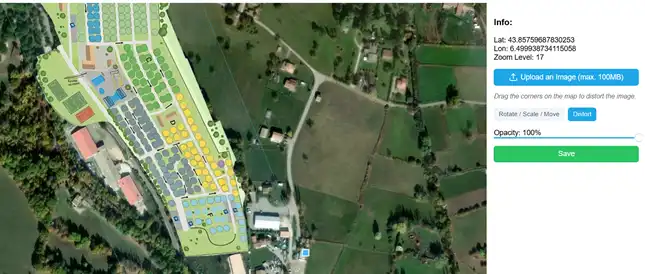
3. Adapt Image on Satellite View
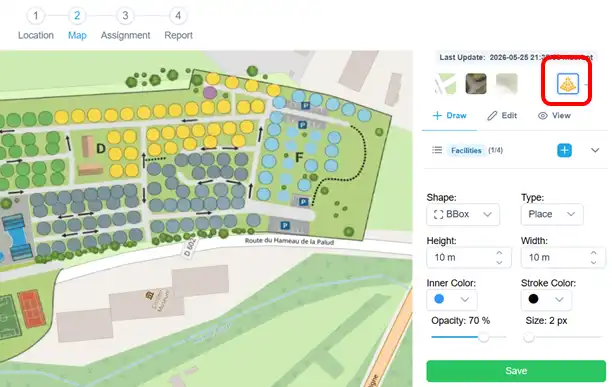
4. Refresh the page after 5 minutes
Measurement Management
Adding Measurements of Type “Line”
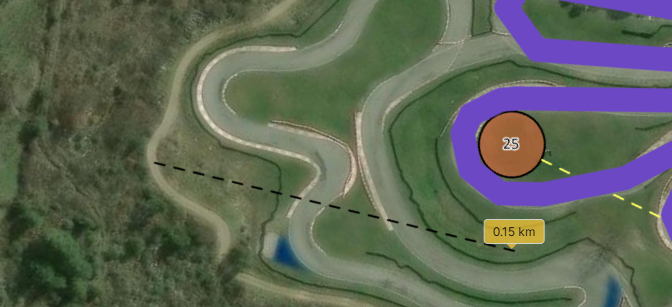
The measurement tool can be accessed from the Toolbox within the "Draw" menu. The shape associated with a measurement is a Line, and you must then specify the Type as Measure.
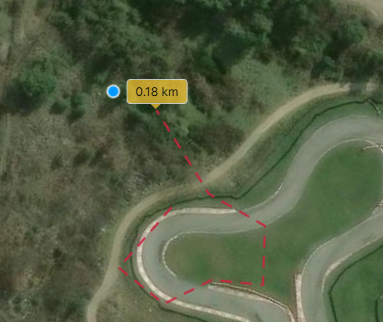
The measured line can consist of a series of connected points or a single straight line. For example, it is possible to trace a shape to calculate its perimeter.
Steps for Adding a Measured Line
- Open the Toolbox and navigate to the Draw menu.
- Select the Shape as Line and set the Type to Measure.
- Click on the map to start drawing the line. Add multiple points for a complex shape or draw a straight line.
- Once complete, the measurement will be displayed dynamically.
Measurements can be used to calculate distances or perimeters by following existing shapes or paths.
Shape Measurements
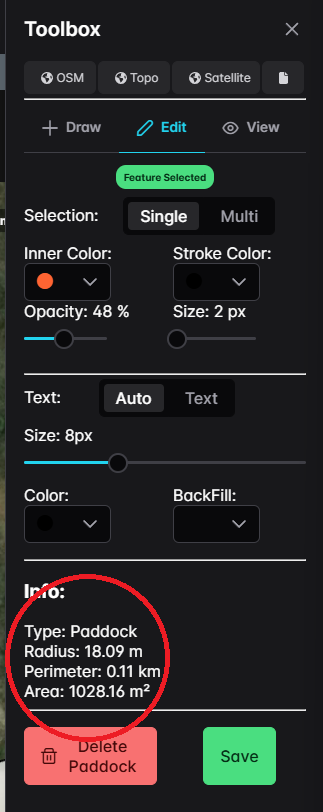
All geometric elements placed on the map automatically include measurements that are displayed in the toolbox. These measurements provide essential details about the drawn shapes.
Available Measurements
- Area (Area): Displays the surface area of polygons.
- Perimeter (Périmètre): Calculates the total boundary length of shapes.
- Radius (Rayon): Specific to circles, it indicates the distance from the center to the edge.
These measurements are updated dynamically as shapes are created or modified, allowing for precise geometry analysis.
Map Zoom Level
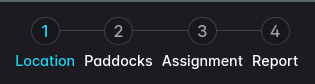
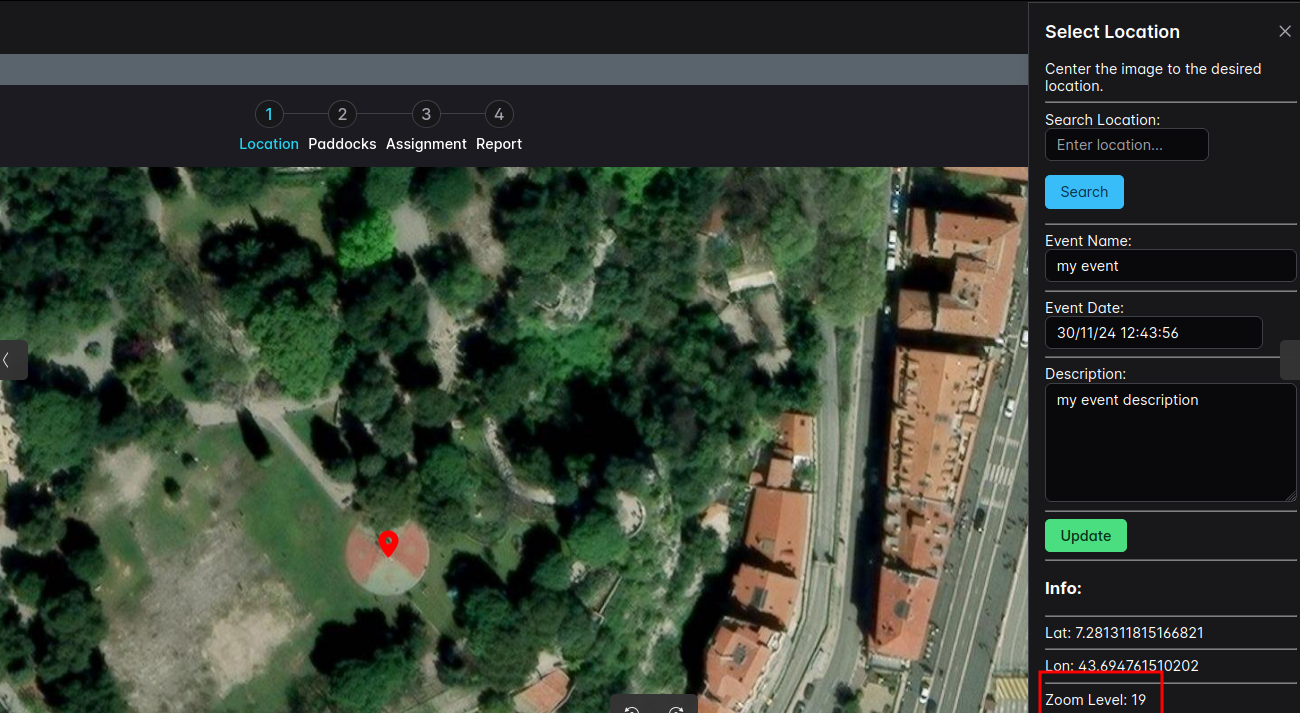
1. If you need to change the Zoom Level globally, you need first to go on 'Location' Tab.
2. Then set the marker by dragging it on the map, and adjust the zoom level using your mouse scroll wheel.
3. Save the location and get back to Paddocks Tab.
Paddocks Keyboard Shortcuts:
Available on Assignment Menu
| Key | Mode | Function |
|---|---|---|
| Shift | Draw (Line) | Draw a continuous line |
| Up | Edit | Move the shape up by 1px |
| Down | Edit | Move the shape down by 1px |
| Left | Edit | Move the shape left by 1px |
| Right | Edit | Move the shape right by 1px |
| Ctrl+D | All | Switch to Draw Mode |
| Ctrl+E | All | Switch to Edit Mode |
| Ctrl+L | All | Switch to View Mode |
| Ctrl+C | Edit | Copy the selected shape (Not available for Measures, Directions and Points) |
| Delete | Edit | Delete the selected shape |
Save Management
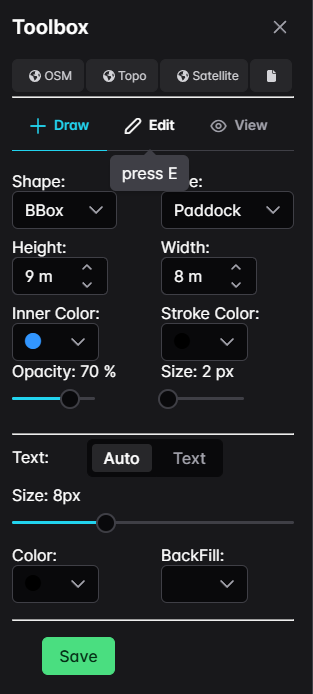
Saving your events, modifications, and creations is not automatic. It is important to save your progress regularly.
This function is directly available from the Toolbox on the right panel in the following views:
- Draw
- Edit
To save, simply click on the Save button.
Participant Creation
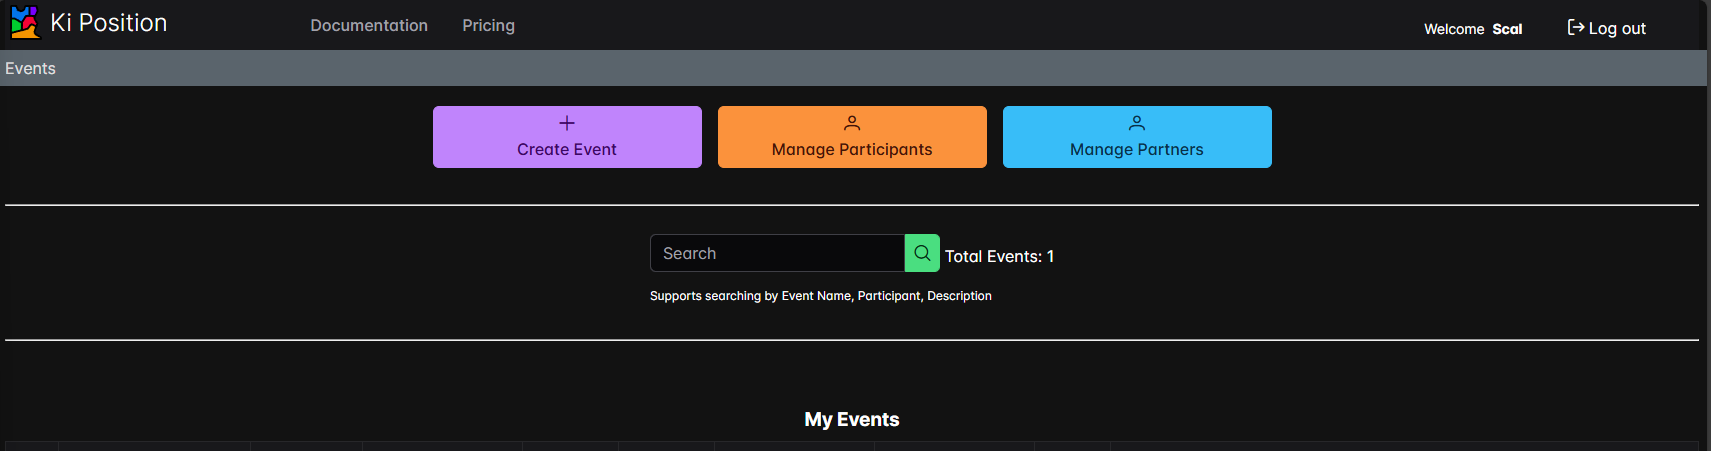
Creating a participant is done from the homepage by clicking on Manage Participants.
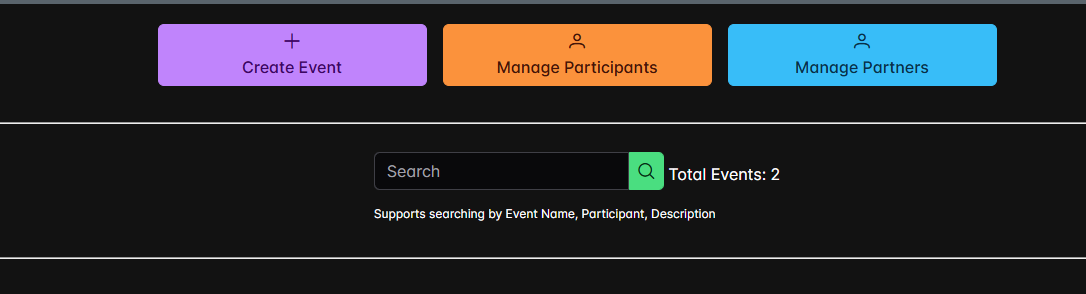
Once in the participant creation menu, if they exist, your participants will be listed in the central section.
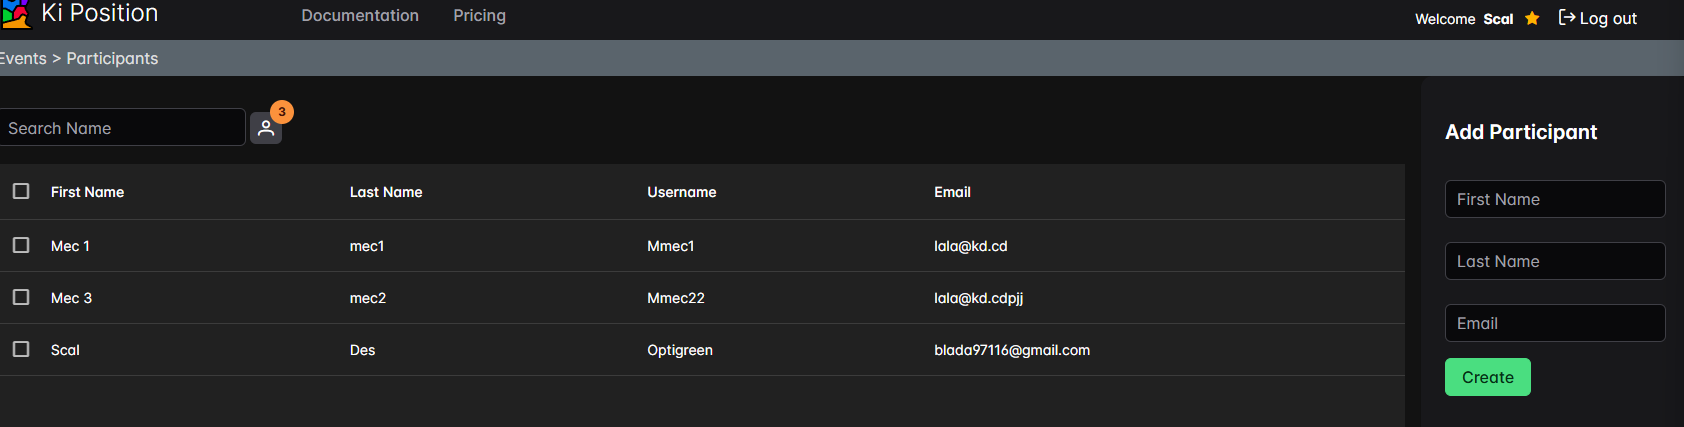
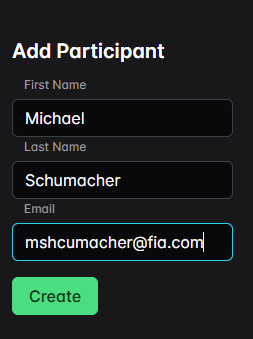
Creating a new participant involves entering the participant's first name, last name, and email address. The record is then saved by clicking the “Create” button.
Partner Creation
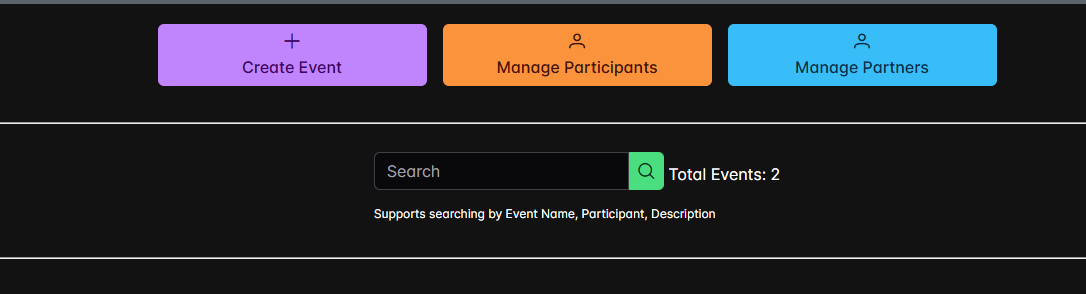
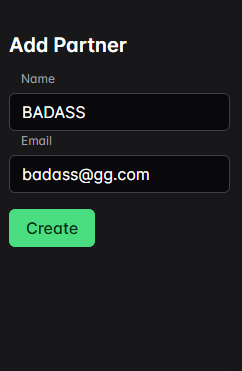
Creating a partner is done from the homepage by clicking on Manage Partners.
Once in the partner creation menu, if they exist, your partners will be listed in the central section.
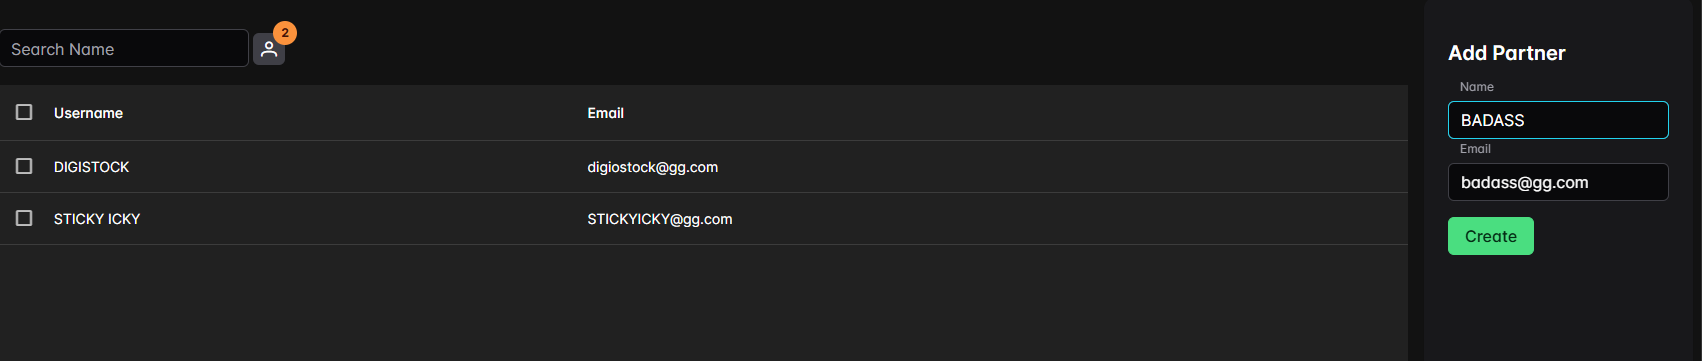
Creating a new partner involves entering the partner's first name, last name, and email address. The record is then saved by clicking the “Create” button
User Assignment
The goal of KiPosition is to precisely define the positions of the locations required for your event. Initially designed for motorsport events, it allows you to assign a location to your participants (partners and drivers).
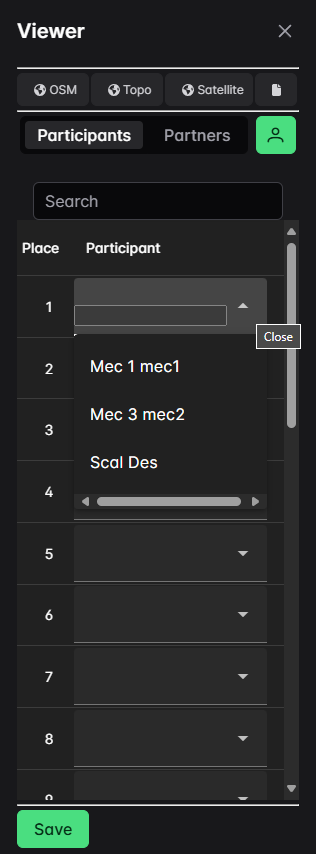
From the Assignment tab, in the viewer positioned on the menu on the right, all "Paddock" items will be listed and sorted according to the numbering that has been defined, in ascending order. For each location, you can assign a participant or a partner by clicking the arrow on the right.
Report Creation
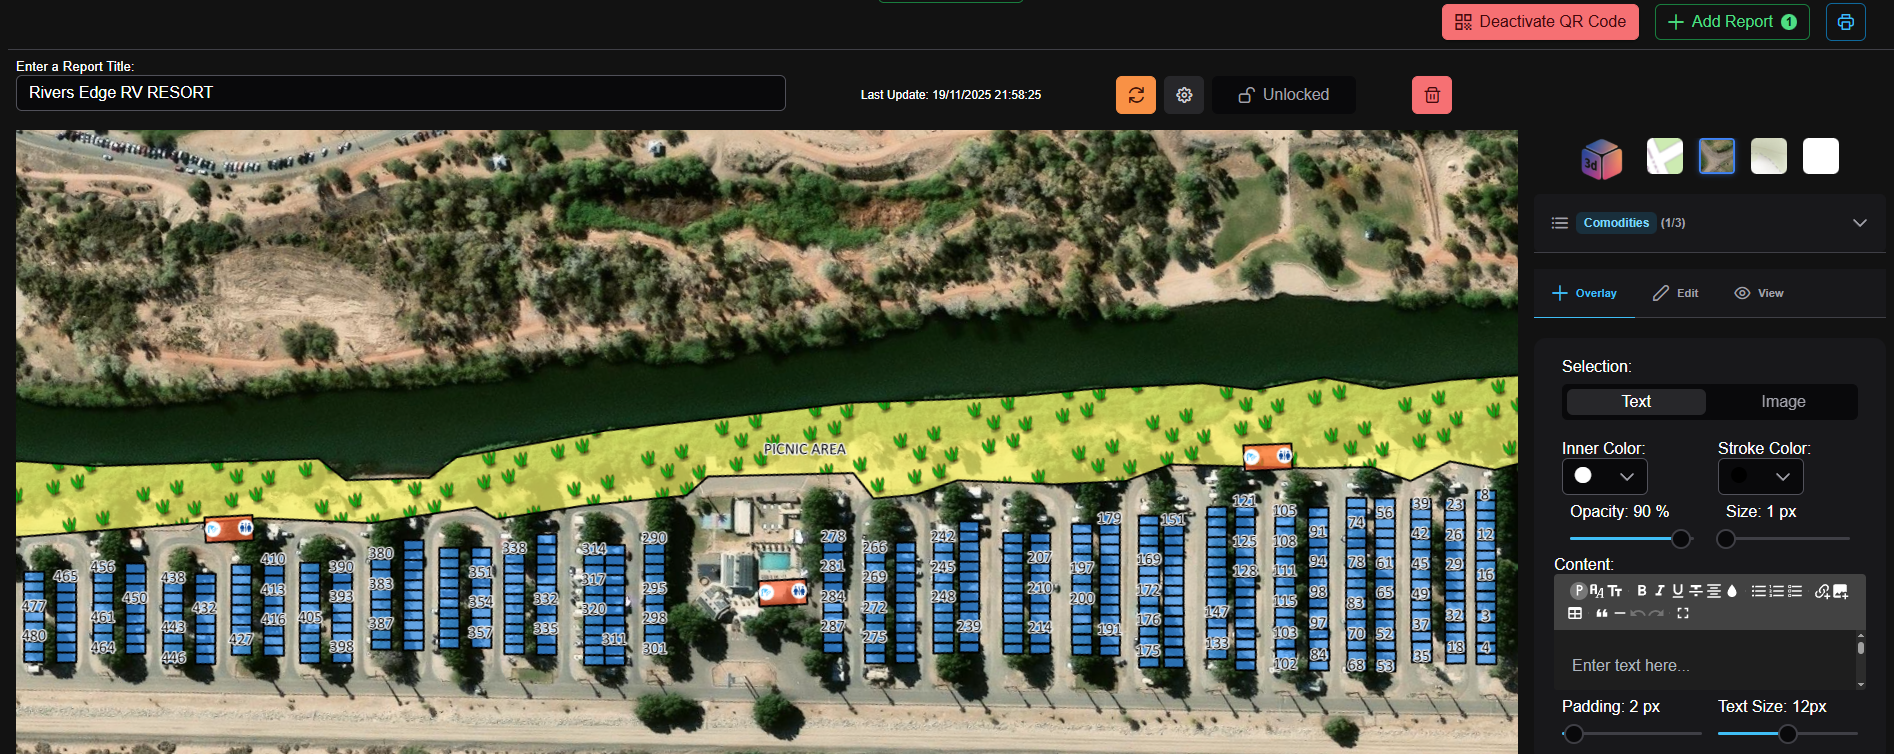
A Report consists of a description and one or more report pages containing text and images that you can add as overlays on top of your map.
After creating a report, you will be able to generate a QR code.
Each report will be available as a view on the tracking page.
Add a Description to Your Report
A map description can be added to your report. The text description is fully customizable, and you can also use copy and paste for both images and text.

Add a Title to Your Report
The title can be added in the text field labeled Enter a Report Title.

Add Embedded Text to the Map
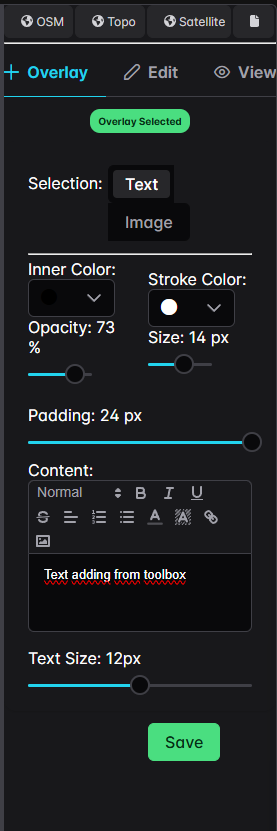
To embed text on the map, use the Toolbox in the Overlay tab and select Text. First, click on the map where you want to place the text box, then enter your text in the Content field.
The following elements can be customized:
- Inner Color → Adjusts the background color of the text box.
- Stroke Color → Changes the border color of the text box.
- Opacity → Controls the transparency of the text box.
- Size → Sets the border width of the text box.
- Padding → Adjusts the space between the text and the edges of the box.
- Content → Edits the text and its formatting.
- Text Size → Changes the font size of the text.
Add Embedded Images to the Map
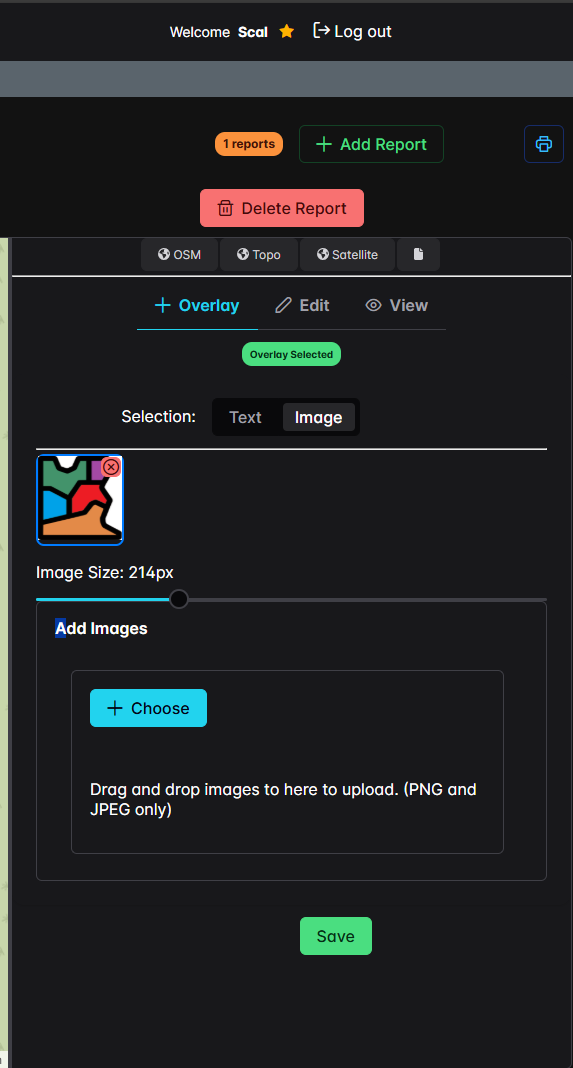
To embed an image on the map, use the Toolbox in the Overlay tab and select Image. You can add an image either by dragging and dropping it or by clicking the Choose button to select a file.
The size of the image on the map can be adjusted using the Image Size slider.
Move a Text Box or Image
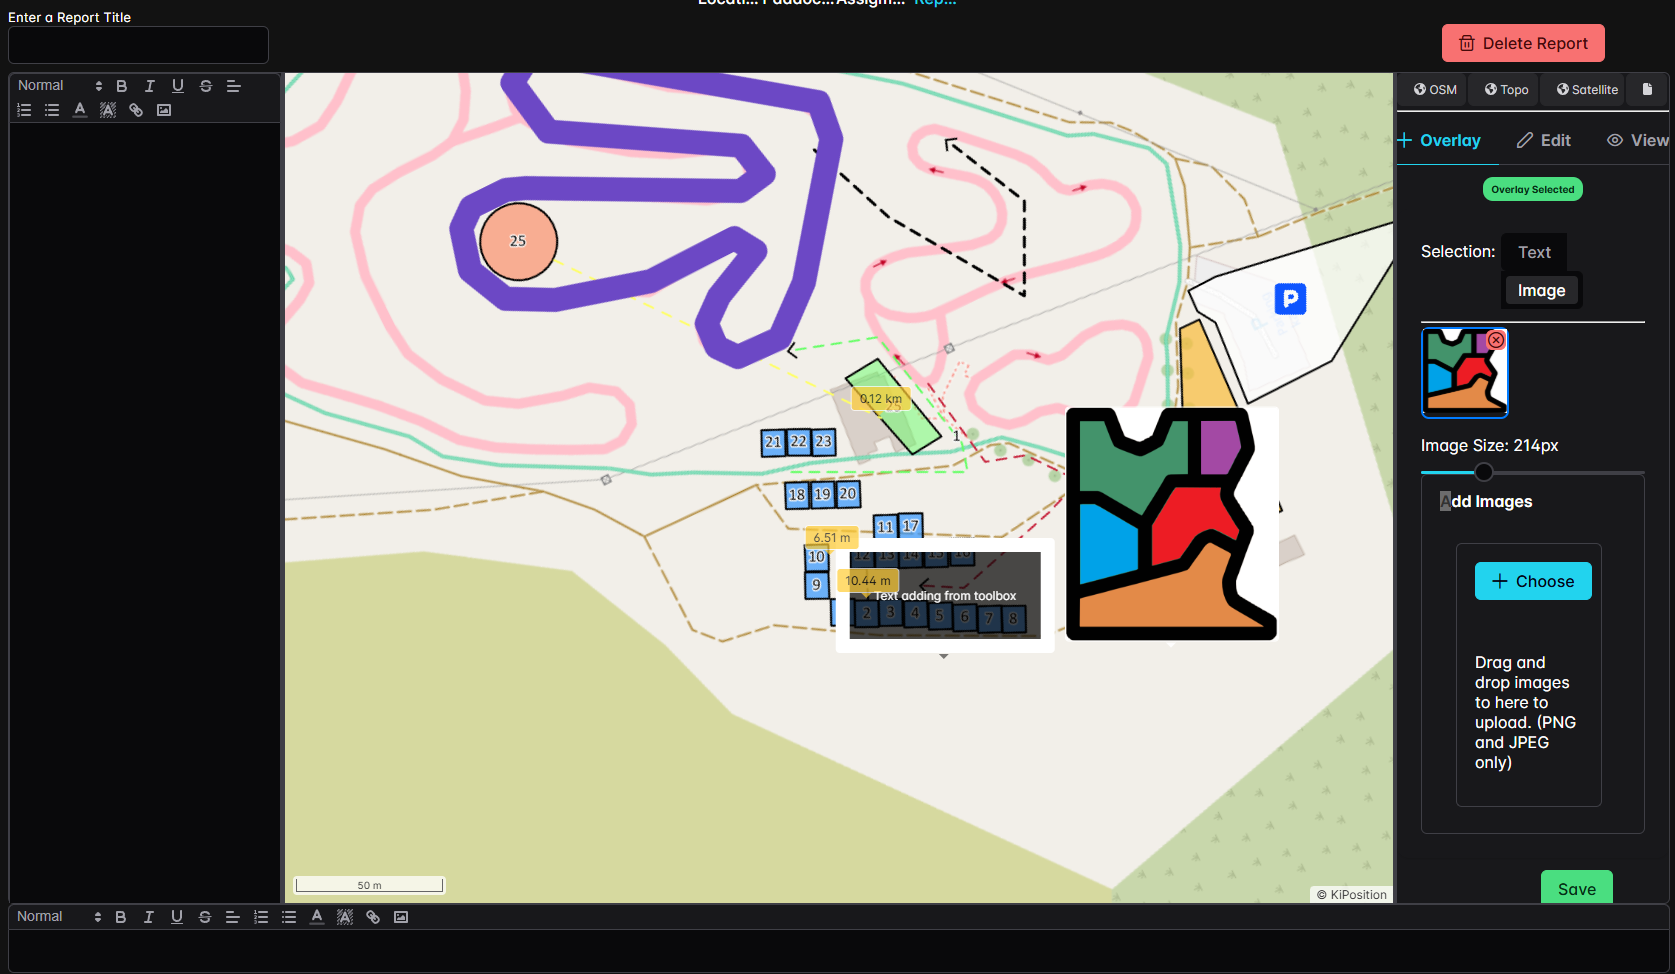
To move a text box or an image, first select the item you want to reposition. Click the Edit tab in the Toolbox. Then click on the item on the map and drag it using your mouse.
Report Legend
Add a Legend
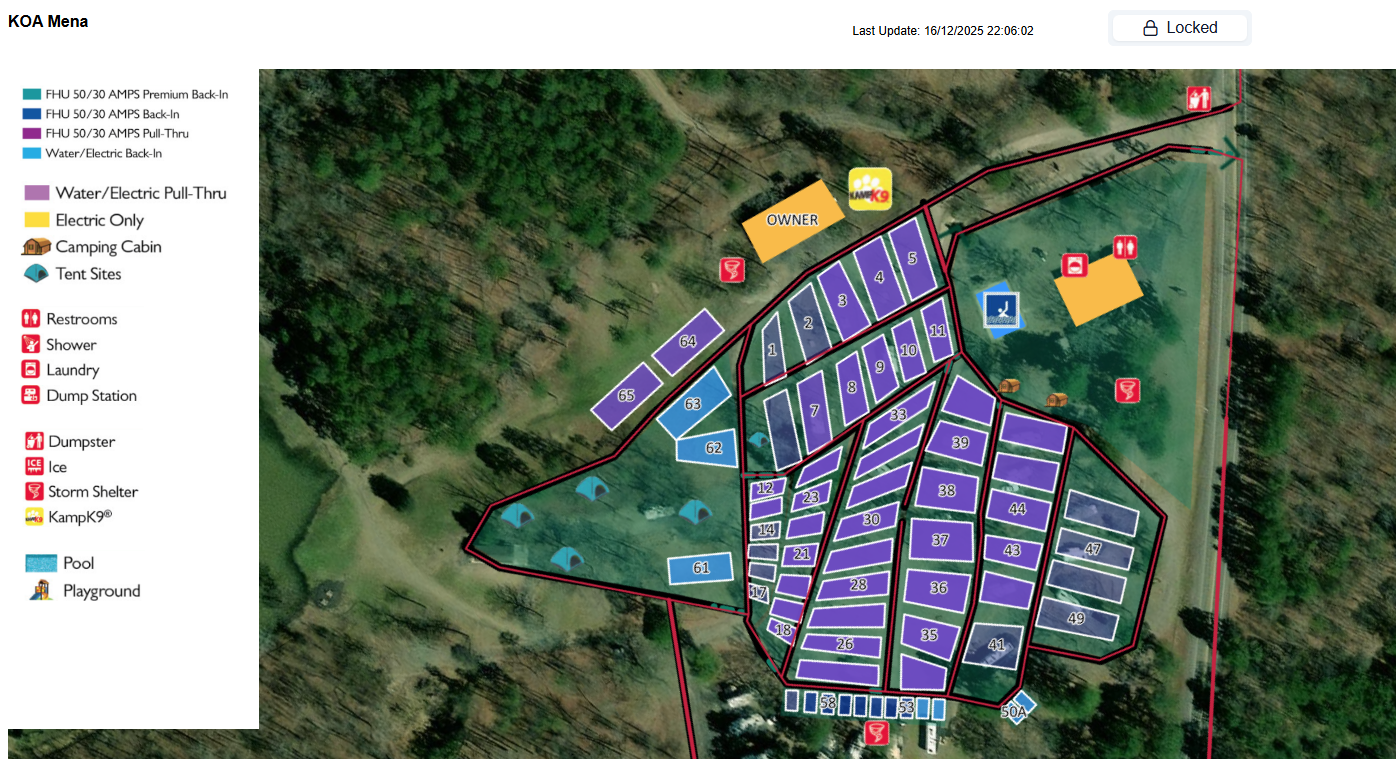
A text area is available to enhance your report by adding notes or a legend to the map. Click on Settings and then enable With Legend.
You can move and resize the text area. You can also edit it by copying and pasting images and text.

Report Save and Print
After completing your report, you can save it using the Save button located at the bottom of the toolbox.
Delete a Report
To delete a report, use the Delete Report.
Print a Report
Reports can be printed using the printer icon located at the top right of the report section. This allows you to either print the report or generate a PDF.

Report Re-Sync
Once a report is created, you need to re-sync it to refresh the map.
After refreshing the map, newly created items are hidden and need to be made visible manually.
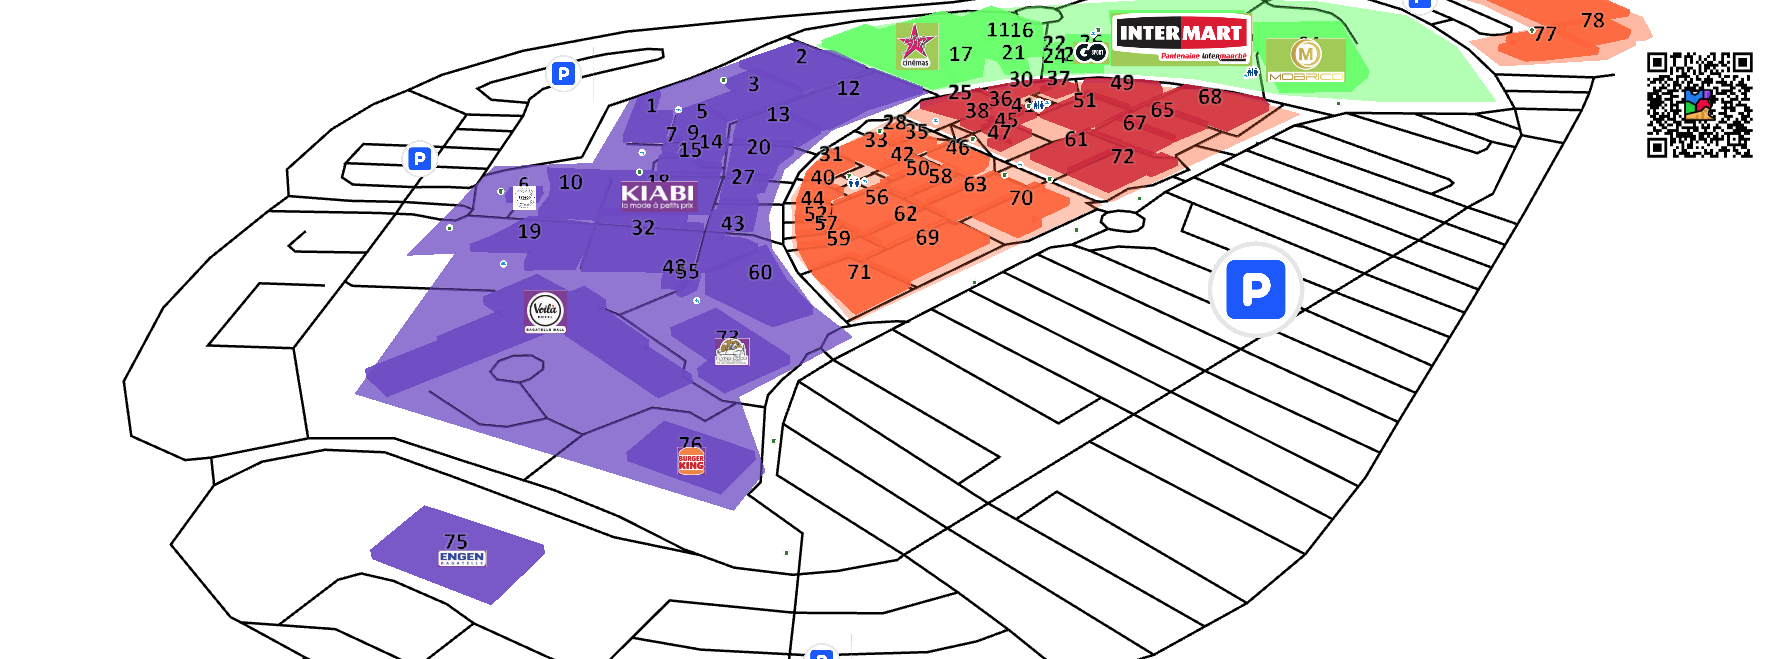
Report 3D Overview
You can customize the rendering to get a 3D overview of your map by activating on the 3D button, then holding Left Ctrl and the left mouse button to move camera. This provides a perspective view of the map.
The 3D rendering is not available in the Tracking View
Activate Tracking
Once your first Report created. You will be able to activate the Tracking with the associated QR-Code.
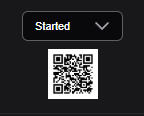
In the Home page you need to set the Event in Started state.
Or in the Report just activate the QR Code Activation for publishing your map.
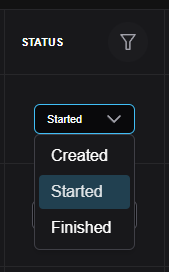
After setting your event to Started, a QR-Code will be available.
The event becomes available and can be shared with others without any restriction.
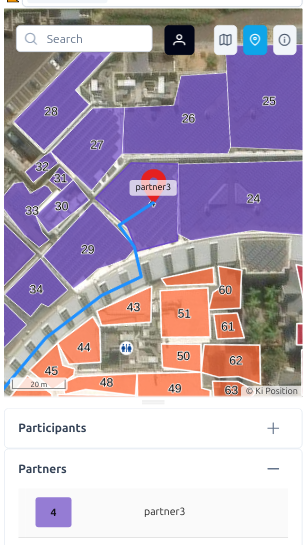
Using the Tracking
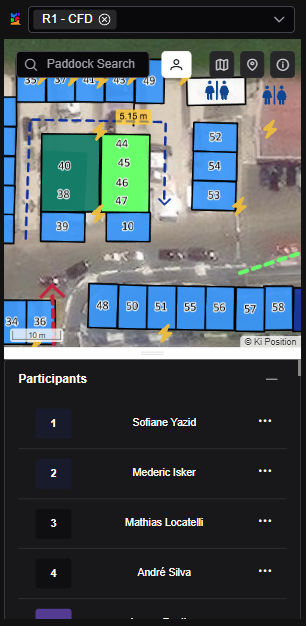
The selection bar allows user to select Reports to display. You can set the first view by enabling Activate by default in tracking in Report Sections.
The following actions can be performed:
- Search for Participants → Use the search bar with the Contact Icon.
- Change Background Map → You can choose the background map.
- Activate your GPS → This allows users to track its position on the map.
- Info → Display the Info related to the Event.
- Click on Map → If a location is clicked the Participant Panel with focus on the associated Participant.
- Click on Participant → The Map will focus on the location of the Participant.
- Details → You can display Participants and Partner details by cliking on ... Icons.
Path Tracking
You need first to draw path lines for your event using the Editor. You can choose between 1-way or 2-way paths.
Once the GPS  is activated, the Viewer is able to find the shortest path among all routes.